Adobe just rolled out a new feature over at Kuler. Pulse is a tool to visualize the colors used on Kuler related to country, season and tag. The color set can be scale in regard on granularity as well as the lighness of the colors.
Archive for the “Infovis” Category
Pulse: Visualizations of kuler colours
Saturday, January 10th, 2009New Year's resolutions
Monday, December 29th, 2008In 2009 we should decrease our graphing addiction and increase attention to coincidences!
happy new year!
The traveller in the map
Monday, December 15th, 2008A close-up of the Earth Globe by Coronelli in which… more
Visual Literacy
Sunday, December 14th, 2008I read Kevin Kelly article on New York Times magazine and I found the concept of Visual Literacy very interesting. Even if our society it is getting aware of the importance of visual language for our contemporary communication, visual language need more research to get to the point of being totally accepted in artefacts where traditionally we use text.
Map of the risk of Malaria in Brazil
Thursday, December 4th, 2008Map of the risk of Malaria in Brasil, originally uploaded… more
Project progress report 02. Systemic approach and causal loop model
Tuesday, November 25th, 2008A causal loop model has been developed in order to help understand the complex systemic structure of poverty in all its dimension. System diagramming is here a loose term used to describe the activity of conceptually representing and visualizing a system in its constitutive elements: the elements, the relationships and the system boundary distinguishing what does and does not belong to the set.
The assumption of this qualitative exercise is that poverty, and its dimensions, are the result of the dynamics between a wide variety of factors from macro-politic, to the personal behavioral patterns.
The key element of the visualization are the factors and the variables. They are the environment attributes and characteristics that have an influence level of poverty.
CityMurmur Project
Thursday, November 20th, 2008HAVE YOU EVER THOUGHT OF A URBAN SPACE SEEN THROUGH THE EYES OF MEDIA?
CityMurmur tries to understand and visualize how media attention reshapes the urban space and the city.

On-line newspapers, information agency, blogs and personal websites, thematic media are monitored to highlight the pattern of perceptions on the urban space. This monitoring activity leads to the creation of an atlas that will produce – in real-time – different maps based on news sources, themes, and time. The atlas allows users to understand the urban space as a function of media attention and biases and social and cultural diversity of the city itself.
The goal of the project is to show how different media differently describe the urban space through the attention that is payed on each street of the city. In the hypothesis of the increasing importance of the on-line presence in contemporary society, a media geography has been generated intersecting the media scape with the geographical reality of the city.
Murmur. Project Progress Report 01
Monday, November 10th, 2008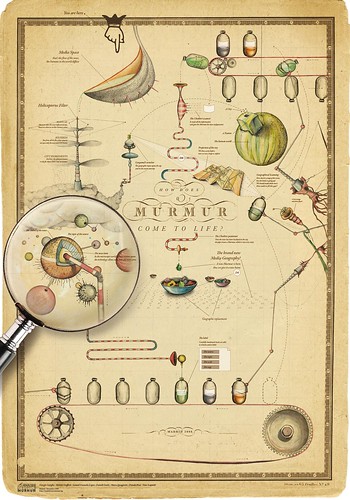
Murmur, originally uploaded by densitydesign.
After a week of cañas, tapas, fried food and heavy work this is the first result of the Visualizar’08 Workshop.
More specifically this is the wiki page of murmur
MURMUR – Call for Collaborators
Wednesday, October 22nd, 2008
Density Design Lab, Knowledgecartography.org and ovrflw, under the nom de plume Writing Acamenic English, are proud to annouce that Murmur is one of the selected project for VISUALIZAR’08: DATABASE CITY.
Torino World Design Capital – Designing Connected Places Summer School – Complexity Maps
Sunday, August 3rd, 2008About Complexity Maps
Torino is a city on the move. The tradition forms of representation are obsolete or inadequate to depict the current reality and the dynamics in progress. How can the city be made legible and comprehensible, understood as a complex organism and as a web of physical and social networks? The urban territory is a system whose complexity is growing, in which a multitude of tangible and intangible flows (people, goods, information) stratify and interconnect.
Output
Environment Group
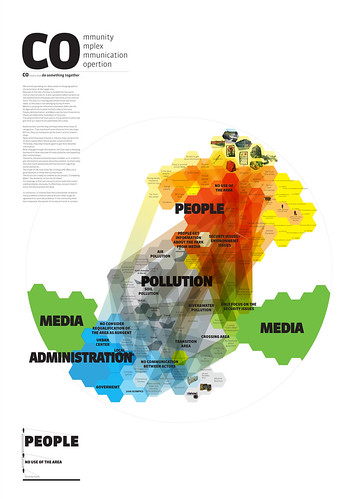
Main Research Conclusion:
The lack of communication between different kinds of actors (people, media, administration) overshadows the environmental and pollution problem of the project area.
History / Future Group
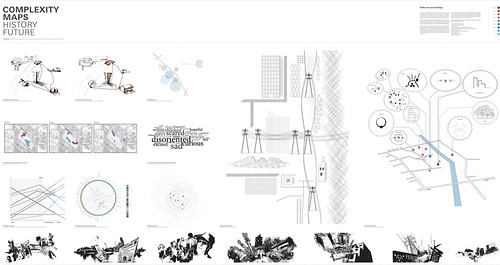
Main Research Conclusion:
In the past social systems like the illegal allotments kept the connections between local actors alive. The place has been disconnected through top down design actions.
Mobility Group
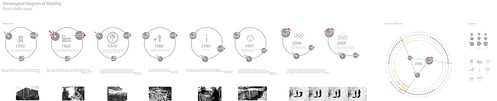
Main Research Conclusion:
The current use of the park has been entirely determined by the a series of external factors that suggest its future dynamics
People Group

Main Research Conclusion:
The locked loops of local policy and money perpetuate a situation of local abandonment which feeds illegal activities and social & political exclusion.
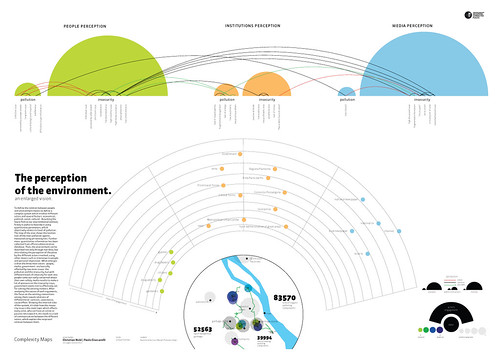
(In)Security Group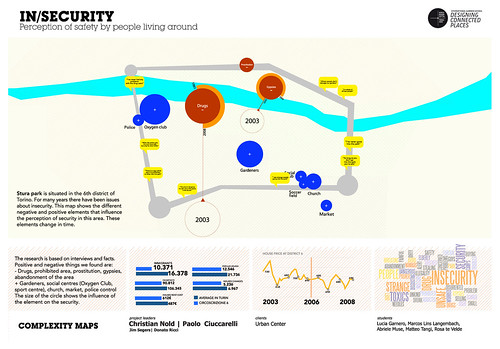
Main Research Conclusion:
the perception of safety in the area changed between 2003 and 2008
- Make 5 Sentences about Saying Disagreement
- Payment Agreement Sample Philippines
- Can Landlord Charge for New Tenancy Agreement
- Spirit Airlines Tax Receivable Agreement
- Ancillary Services Agreement
- Download Agreement by Shanko Rasheed
- Facebook User Agreement Photos
- Music Production Contracts Templates
- Do Contractors Do Financing
- Free Trade Agreement Russia
- Stock Purchase Agreement Good or Bad
- Terminating Employee Contract Early
- It Support Agreements
- Iran Nuclear Agreement Terms
- Rental Lease Agreement for Ct
- Tcode for Display Contract Status
- Contracts Manager Jobs in Bangalore
- Behavioral Health Contractors Association
- User Agreement in Arabic
- Rcuh Agreement for Services