We have been officially invited to present the CityMurmur project… more
Archive for the “Complexity” Category
CityMurmur going to SIGGRAPH09
Wednesday, July 29th, 2009FRONTIERS OF INTERACTION V
Monday, June 15th, 2009Last Monday the Fifth Edition of Frontiers of Interaction took… more
The Economist: Mapping a better world
Monday, June 8th, 2009This morning flipping trough the last issue of the Economist,… more
Complexity, Complication, Visualization and Interaction
Tuesday, March 24th, 2009According to the article of Veronique Greenwood in SEED Magazine… more
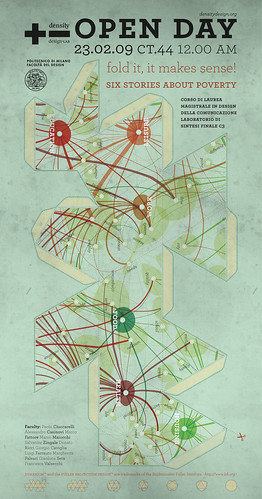
Fold it, it makes sense! Six stories about poverty.
Monday, February 16th, 2009Who are the poor? Poverty is neither a number nor an index. It cannot be reduced to a line that divides those who are above and those who are below establishing a unique space for social exclusion. Poverty is a multidimensional and complex phenomenon. Its reduction to a unique representation can generate distorted visions of the phenomenon and create ineffective or counterproductive interventions.
Twitter Chatter During the Super Bowl
Monday, February 9th, 2009From NewYork Times Interactive comes this simple visualization of the… more
Jules & Jim
Friday, January 23rd, 2009Often love affairs are instable, fleeting and unpredictable. It seems… more
Project progress report 02. Systemic approach and causal loop model
Tuesday, November 25th, 2008A causal loop model has been developed in order to help understand the complex systemic structure of poverty in all its dimension. System diagramming is here a loose term used to describe the activity of conceptually representing and visualizing a system in its constitutive elements: the elements, the relationships and the system boundary distinguishing what does and does not belong to the set.
The assumption of this qualitative exercise is that poverty, and its dimensions, are the result of the dynamics between a wide variety of factors from macro-politic, to the personal behavioral patterns.
The key element of the visualization are the factors and the variables. They are the environment attributes and characteristics that have an influence level of poverty.
CityMurmur Project
Thursday, November 20th, 2008HAVE YOU EVER THOUGHT OF A URBAN SPACE SEEN THROUGH THE EYES OF MEDIA?
CityMurmur tries to understand and visualize how media attention reshapes the urban space and the city.
On-line newspapers, information agency, blogs and personal websites, thematic media are monitored to highlight the pattern of perceptions on the urban space. This monitoring activity leads to the creation of an atlas that will produce – in real-time – different maps based on news sources, themes, and time. The atlas allows users to understand the urban space as a function of media attention and biases and social and cultural diversity of the city itself.
The goal of the project is to show how different media differently describe the urban space through the attention that is payed on each street of the city. In the hypothesis of the increasing importance of the on-line presence in contemporary society, a media geography has been generated intersecting the media scape with the geographical reality of the city.
How does a Murmur come to life?
Monday, November 10th, 2008- Make 5 Sentences about Saying Disagreement
- Payment Agreement Sample Philippines
- Can Landlord Charge for New Tenancy Agreement
- Spirit Airlines Tax Receivable Agreement
- Ancillary Services Agreement
- Download Agreement by Shanko Rasheed
- Facebook User Agreement Photos
- Music Production Contracts Templates
- Do Contractors Do Financing
- Free Trade Agreement Russia
- Stock Purchase Agreement Good or Bad
- Terminating Employee Contract Early
- It Support Agreements
- Iran Nuclear Agreement Terms
- Rental Lease Agreement for Ct
- Tcode for Display Contract Status
- Contracts Manager Jobs in Bangalore
- Behavioral Health Contractors Association
- User Agreement in Arabic
- Rcuh Agreement for Services


