We’re glad to announce our contribution on Tafterjournal. We’re presenting… more
Archive for the “Decision Making” Category
Città Polifoniche: a contribution on TafterJournal
Monday, April 2nd, 2012DensityDesign in Bruxelles – when visualization meets other disciplines (and sets the fire on!)
Tuesday, March 20th, 2012We’re just back from a speech at the Human Cities… more
A map of possible scenarios
Saturday, May 1st, 2010The Afghan Conflict – A Map of Possible Scenarios starts… more
From what to what? DensityDesign at DD4D
Wednesday, July 8th, 2009The main focus of DD4D Conference (Data Designed for Decisions)… more
In Whiteboard we trust
Tuesday, June 9th, 2009
This is the DensityDesign’s whiteboard, as usual, full of projects and thoughts.
The Economist: Mapping a better world
Monday, June 8th, 2009This morning flipping trough the last issue of the Economist,… more
Telling amazing stories
Monday, April 27th, 2009We have receive the visit from a friend that is… more
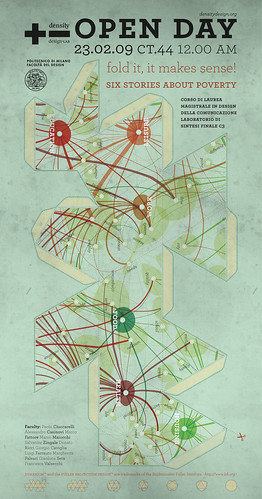
Fold it, it makes sense! Six stories about poverty.
Monday, February 16th, 2009Who are the poor? Poverty is neither a number nor an index. It cannot be reduced to a line that divides those who are above and those who are below establishing a unique space for social exclusion. Poverty is a multidimensional and complex phenomenon. Its reduction to a unique representation can generate distorted visions of the phenomenon and create ineffective or counterproductive interventions.
New Year's resolutions
Monday, December 29th, 2008In 2009 we should decrease our graphing addiction and increase attention to coincidences!
happy new year!
Project progress report 02. Systemic approach and causal loop model
Tuesday, November 25th, 2008A causal loop model has been developed in order to help understand the complex systemic structure of poverty in all its dimension. System diagramming is here a loose term used to describe the activity of conceptually representing and visualizing a system in its constitutive elements: the elements, the relationships and the system boundary distinguishing what does and does not belong to the set.
The assumption of this qualitative exercise is that poverty, and its dimensions, are the result of the dynamics between a wide variety of factors from macro-politic, to the personal behavioral patterns.
The key element of the visualization are the factors and the variables. They are the environment attributes and characteristics that have an influence level of poverty.
- Make 5 Sentences about Saying Disagreement
- Payment Agreement Sample Philippines
- Can Landlord Charge for New Tenancy Agreement
- Spirit Airlines Tax Receivable Agreement
- Ancillary Services Agreement
- Download Agreement by Shanko Rasheed
- Facebook User Agreement Photos
- Music Production Contracts Templates
- Do Contractors Do Financing
- Free Trade Agreement Russia
- Stock Purchase Agreement Good or Bad
- Terminating Employee Contract Early
- It Support Agreements
- Iran Nuclear Agreement Terms
- Rental Lease Agreement for Ct
- Tcode for Display Contract Status
- Contracts Manager Jobs in Bangalore
- Behavioral Health Contractors Association
- User Agreement in Arabic
- Rcuh Agreement for Services


