Author Archive

CityMurmur Project

Thursday, November 20th, 2008

HAVE YOU EVER THOUGHT OF A URBAN SPACE SEEN THROUGH THE EYES OF MEDIA?
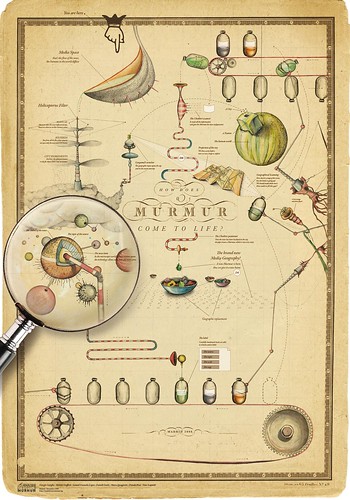
CityMurmur tries to understand and visualize how media attention reshapes the urban space and the city.

On-line newspapers, information agency, blogs and personal websites, thematic media are monitored to highlight the pattern of perceptions on the urban space. This monitoring activity leads to the creation of an atlas that will produce – in real-time – different maps based on news sources, themes, and time. The atlas allows users to understand the urban space as a function of media attention and biases and social and cultural diversity of the city itself.
The goal of the project is to show how different media differently describe the urban space through the attention that is payed on each street of the city. In the hypothesis of the increasing importance of the on-line presence in contemporary society, a media geography has been generated intersecting the media scape with the geographical reality of the city.

Murmur. Project Progress Report 01

Monday, November 10th, 2008


Murmur
, originally uploaded by densitydesign.

After a week of cañas, tapas, fried food and heavy work this is the first result of the Visualizar’08 Workshop.

More specifically this is the wiki page of murmur

Project progress report 01. Economic statistic & Communication Design

Thursday, October 30th, 2008

Economic statistic concerns understanding complex, multidimensional, ambiguous and dynamic phenomena building formal representations (models) based on statistical data. Communication Design addresses complex phenomena to interact with them building multi-dimensional visual representations based (in some cases) on statistical data.
The DensityDesign Lab approach, partially modified despite past editions, tries to foster this alliance in order to explore socio-economic phenomena that present both representational and visual problems. In fact they could be:
complex;

* multidimensional;
* dynamic and evolutionary;
* not numerically measurable if not qualitatively;
* ambiguous and fuzzy;
* not dichotomous;
* of great impact on people and society.

The goal is to contribute to the construction of representation and visualization model respecting and preserving the inner structure of the analyzed phenomena, allowing users to know (see) them as a whole. This is not primarily a design issue, but an epistemological one; the aspect of visual representation and communication is only one part of a bigger topic. The broader aim is helping in build a cognitive process that integrates and combines different disciplines and skills.

Numbers & Statistics, Biases & Emotions

Sunday, October 26th, 2008

27 August 2008
Michael Bond
http://www.newscientist.com/article/mg19926711.500-how-to-keep-your-head-in-scary-situations.html

This has led Slovic to suggest we need to imbue statistics with more emotional significance so that we take them to heart. “We learn how to deal with numbers from a young age as cold or abstract entities – to read them, add them, multiply them – but we don’t learn to think about how they represent reality in a way that conveys feeling and meaning. We need to think how to teach people to step away from their intuitive response, which is insensitive to magnitude, and think more carefully about what numbers represent.” […]

MURMUR – Call for Collaborators

Wednesday, October 22nd, 2008


Density Design Lab, Knowledgecartography.org and ovrflw, under the nom de plume Writing Acamenic English, are proud to annouce that Murmur is one of the selected project for VISUALIZAR’08: DATABASE CITY.

Density 5.0

Wednesday, October 8th, 2008


calendario 2008-2009
, originally uploaded by densitydesign.

Changing the change Paper

Friday, September 26th, 2008

HANDLING CHANGES THROUGH DIAGRAMS
To change towards a more sustainable development could means to make decisions not only with a systemic approach, but also to be able to decide in the right time: the density. It seems that, when the discipline of Design integrate a systemic approach with the competences of designers in visualization, it can cope with dense situations, providing effective artefacts – diagrams – to improve the decision process and making profit from the richness of complexity.

Experience & Imagination

Wednesday, September 3rd, 2008

Knowing Complex Systems. The limits of understanding
Due to their non-linear nature, complex systems are incompressible. They are also open systems and cannot be understood without also understanding their environments and their history. To fully know something complex will therefore involve incorporating all the complexity of the system and its environment. This not humanly possible, perhaps not even possible in principle. Thus, our models of complex systems always have to reduce the complexity. Since what is left out also has non-linear effects, we cannot predict the error made in the reduction. The modelling and understanding of complex system thus always involve an element of choice which cannot be justified by pure calculation. There is always a normative element involved.

Torino World Design Capital – Designing Connected Places Summer School – Complexity Maps

Sunday, August 3rd, 2008

About Complexity Maps
Torino is a city on the move. The tradition forms of representation are obsolete or inadequate to depict the current reality and the dynamics in progress. How can the city be made legible and comprehensible, understood as a complex organism and as a web of physical and social networks? The urban territory is a system whose complexity is growing, in which a multitude of tangible and intangible flows (people, goods, information) stratify and interconnect.

Output
Environment Group
Environment

Environment

Main Research Conclusion:
The lack of communication between different kinds of actors (people, media, administration) overshadows the environmental and pollution problem of the project area.

History / Future Group
History and Future

Main Research Conclusion:
In the past social systems like the illegal allotments kept the connections between local actors alive. The place has been disconnected through top down design actions.

Mobility Group
Mobility

Main Research Conclusion:
The current use of the park has been entirely determined by the a series of external factors that suggest its future dynamics

People Group
People

Main Research Conclusion:
The locked loops of local policy and money perpetuate a situation of local abandonment which feeds illegal activities and social & political exclusion.

(In)Security Group(In)Security

Main Research Conclusion:
the perception of safety in the area changed between 2003 and 2008

Complexity Maps

Friday, August 1st, 2008


Complex Faces
, originally uploaded by densitydesign.

TWDC – Designing connected places Summer School –
Thank you all, it was amazing.