
Density Design Lab, Knowledgecartography.org and ovrflw, under the nom de plume Writing Acamenic English, are proud to annouce that Murmur is one of the selected project for VISUALIZAR’08: DATABASE CITY.
Archive for the “Representation” Category
MURMUR – Call for Collaborators
Wednesday, October 22nd, 2008The inside diagram
Wednesday, September 10th, 2008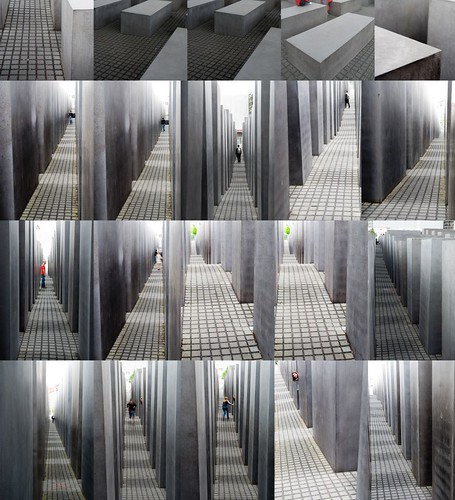
The traditional monument is understood by its symbolic imagery, by what it represents. It is not understood in time, but in an instant in space; it is seen and understood simultaneously. Even in traditional architectures such as labyrinths and mazes, there is a space-time continuum between experience and knowing; one has a goal to work one’s way in or out.
Experience & Imagination
Wednesday, September 3rd, 2008Knowing Complex Systems. The limits of understanding
Due to their non-linear nature, complex systems are incompressible. They are also open systems and cannot be understood without also understanding their environments and their history. To fully know something complex will therefore involve incorporating all the complexity of the system and its environment. This not humanly possible, perhaps not even possible in principle. Thus, our models of complex systems always have to reduce the complexity. Since what is left out also has non-linear effects, we cannot predict the error made in the reduction. The modelling and understanding of complex system thus always involve an element of choice which cannot be justified by pure calculation. There is always a normative element involved.
Pizza (Pie) Chart
Tuesday, April 29th, 2008
Pizza (Pie) Chart, originally uploaded by densitydesign.
Each election period reminds us that magazines and newspapers are playing a fundamental role in the evolution of infographics as a diffused and common (public) language.
Infographics are more and more used not only to communicate data and information, but also to produce eye-catching, evocative illustrations, to be shown in magazine covers. It happens sometimes that the evocative purpose prevails on the informative one, like in the n.1041 of the “Il Venerdì”, a weekly supplement-magazine of the “La Repubblica”, one of the major italian newspaper.
Tempting trails left unexplored
Wednesday, April 23rd, 2008
Fab, originally uploaded by densitydesign.
[img: Fab/ Summer 2005 /Leonora Sartori+Francesco Meneghini]
As Peter Turchi says (in Maps of the Imagination: the writer as cartographer): “To ask for a map is to say: Tell me a story”.
A selected story, surrounded by blank spaces, sometimes more significant than the story itself, a story from the skew mental map of ourselves
Election Day
Sunday, April 13th, 2008 
election day, originally uploaded by densitydesign.
Density Design (GS+DR) is returning officer and secretary in one of the polling station during the italian election day 2008.
The compulsive obsession for graphs and diagrams led us to draw this…
From the tree to the labyrinth
Friday, April 11th, 2008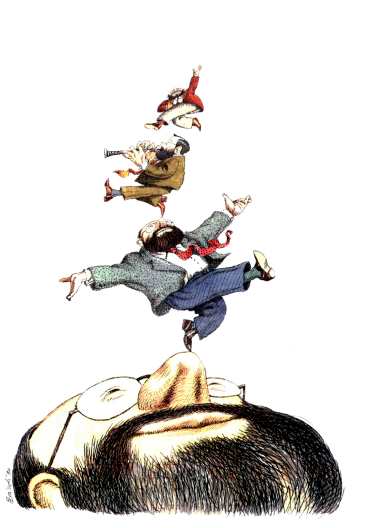
In the 100 pages of first chapter of Umberto Eco new book From the tree to the labyrinth (Dall’albero al labirinto. Studi storici sul segno e l’interpretazione, Bompiani, nov 2007), Eco writes about semiotic dictionary and encyclopaedia and discusses – trough diagram and charts – the problem of definition and classification. I found it very thought-provoking and it remember me the Nietzsche quote that I tell to my students when I want to point out they have to incorporate indeterminacy when working as designers:
There isn't one space
Wednesday, April 2nd, 2008
I was just hanging around in a library close to my office and I bought George Perec’s Species of Spaces and Other Pieces. While my friend was driving us back home I started to read it out, and that book became our map of a different city, a bright inspiration for the debate about space and urban planning. Try the experiment:
Biomapping Cities
Thursday, January 17th, 2008Christian Nold thinks we should pay more attention to how… more
Modalità semiosiche
Wednesday, January 16th, 2008
Icona, Indice e Simbolo non sono solo “tre tipi di segni”. Sono innanzitutto tre modalità semiosiche. La semiosi, il passaggio dall’Oggetto Dinamico alla Rappresentazione segnica, e da qui all’Interpretante, è un processo (ad esempio di trasformazione, di traduzione, di correlazione e di stabilizzazione delle correlazioni, ecc.) e tale processo è appunto caratterizzato da tre modalità:
- Make 5 Sentences about Saying Disagreement
- Payment Agreement Sample Philippines
- Can Landlord Charge for New Tenancy Agreement
- Spirit Airlines Tax Receivable Agreement
- Ancillary Services Agreement
- Download Agreement by Shanko Rasheed
- Facebook User Agreement Photos
- Music Production Contracts Templates
- Do Contractors Do Financing
- Free Trade Agreement Russia
- Stock Purchase Agreement Good or Bad
- Terminating Employee Contract Early
- It Support Agreements
- Iran Nuclear Agreement Terms
- Rental Lease Agreement for Ct
- Tcode for Display Contract Status
- Contracts Manager Jobs in Bangalore
- Behavioral Health Contractors Association
- User Agreement in Arabic
- Rcuh Agreement for Services