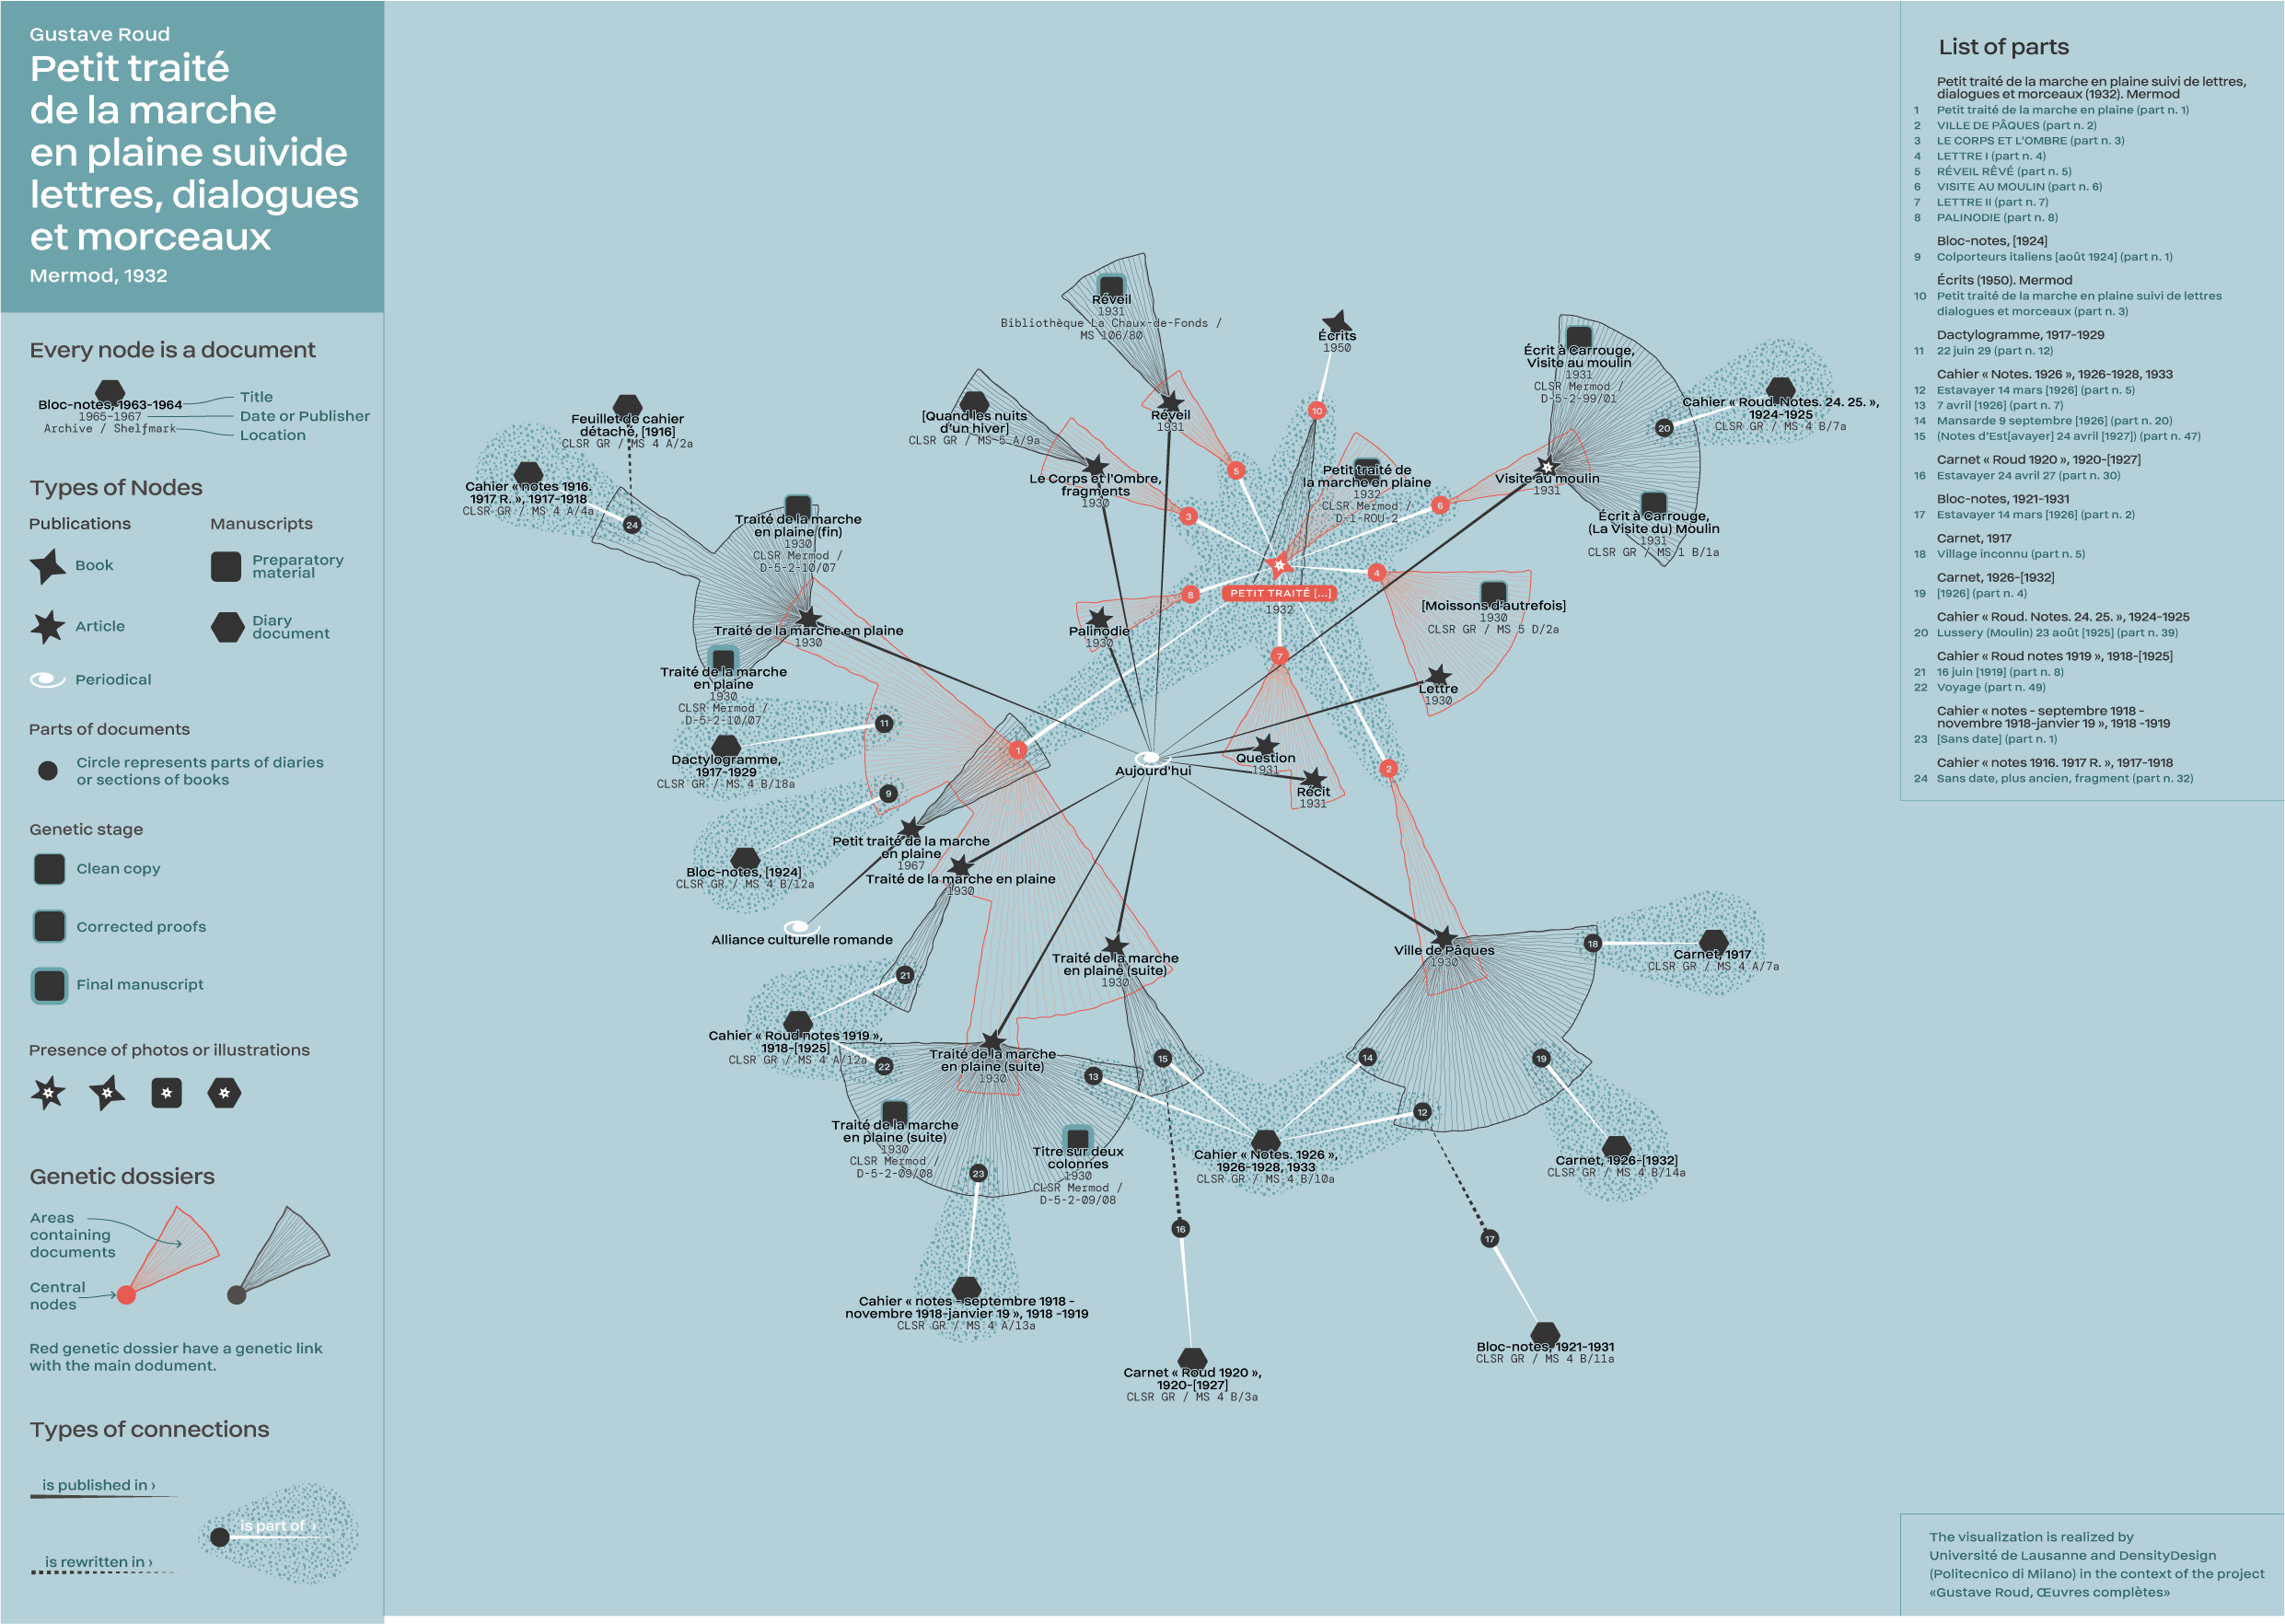
The project provides a visual representation of the creative process followed by Gustave Roud in the making of some of his most famous literary works. We refer to these visualizations with the phrase “genetic networks”, because they support scholars in inquiring the genesis of literary works. This work is part of the bigger initiative entitled Gustave Roud, «Œuvres complètes», funded by the FNS.

The project draws from a meticulous collection conducted on the archive of Roud by Daniel Maggetti, Elena Spadini, Alessio Christen, plus collaborators from the Université de Lausanne. They examined diaries, notepads, and other preparatory materials in search for clues and evidences of development of Roud’s ideas and writings.
Their work produced a body of data that is compiled following a dedicated ontological model, which allows to store materials and the genetic relations that connect them. The following image summarises the ontological model, and an extensive description can be retrieved from a dedicated publication (Spadini and Christen, 2019).

Our group followed a process composed of different phases.

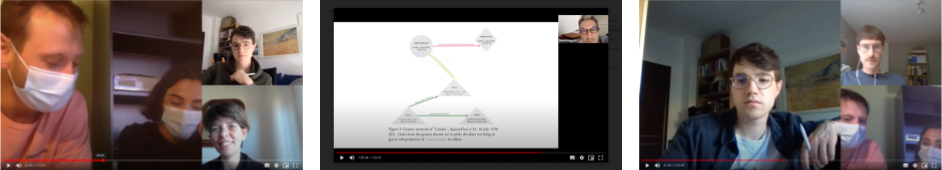
As a first step we conduced interviews with the three stakeholders, aimed at learning about their research interests, the discipline of genetic criticism, and their work of data collection. Additionally we asked them to “read-and-think-aloud” some preliminary visualizations that they autonomously produced.
We successively spent a considerable amount of time with the data. We manually re-structured in “nodes” and “edges” and visualized it within Gephi.

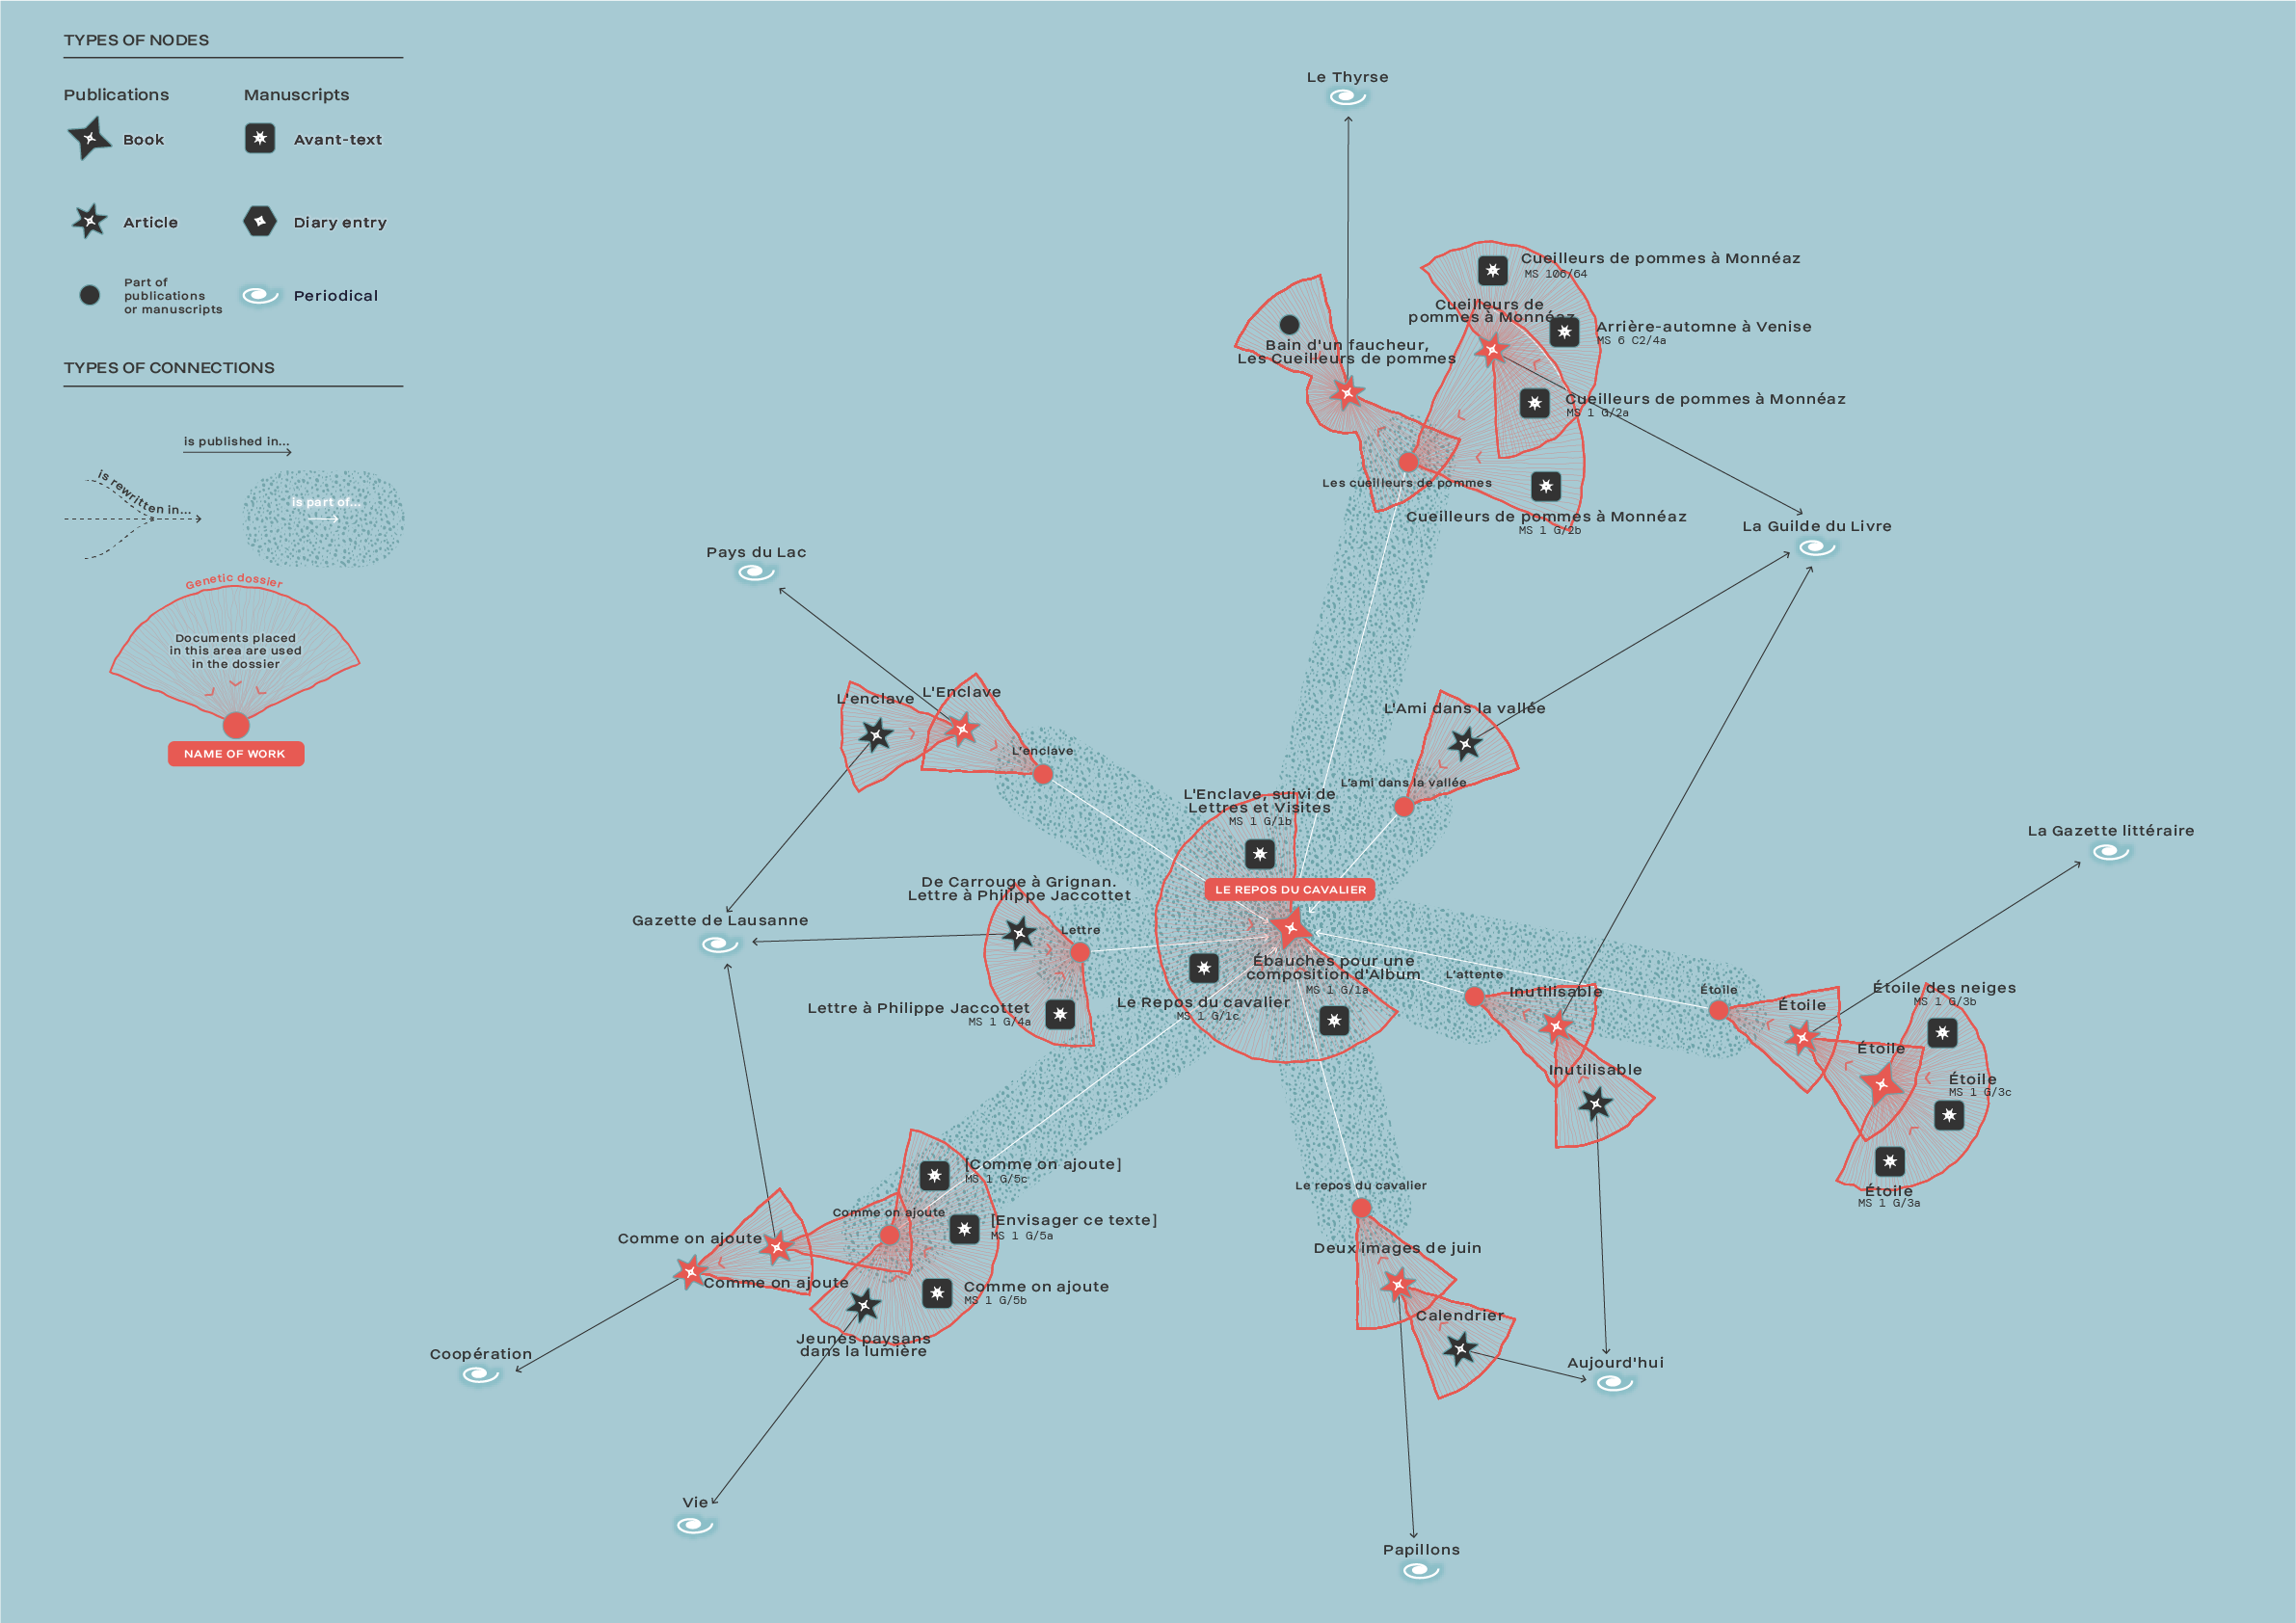
A fundamental part of this process was the understanding of the difference between two level of scholarly analysis: one that is factual and relates to tangible materials part of the archive, and the other that is interpretative and regards the genetic relations identified among the materials. The ontological model foresees this issues and introduces “genetic dossier”, a specific element that is supposed to act as proxy between a publication and a group of preparatory materials. The dossiers are there to recall that every element grouping represents an interpretation of scholars, which might be different if performed by other people or if further materials were available. To make a more accessible visualization, we decided to transform each dossier, from a proxy-node, into a grouping mark, and to figure out a specify graphical treatment to make apparent its interpretive nature.

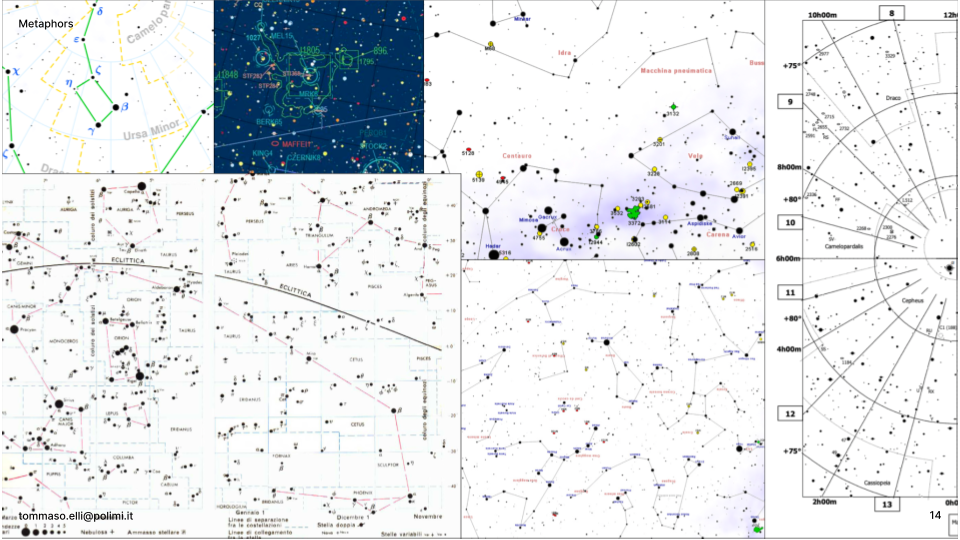
The visual language of the genetic networks is synthesised with the employment of a visual metaphor. Our choice of “embellishment” resonates with a consolidated strategy in information visualization, aimed at improving the memorability of charts. We designed and conducted a dedicated activity with our stakeholders to select a metaphor from a three pertinent possibilities. We decided to rely on astral charts and we created a visual language that enhance network graphs and encodes the genetic data.

Before creating a total of ten visualizations, we produced three drafts that we used for an evaluation activity with a stakeholder not involved in the design process. We run an interview and asked to read comments and indicate improvements to the drafts. In particular we learnt from the activity we learned how to make a better use of colours and chronological informations.
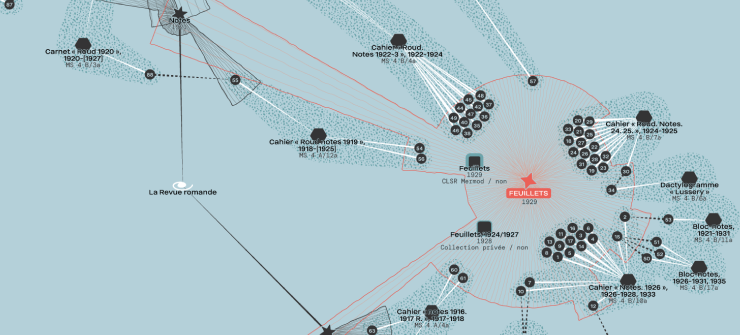
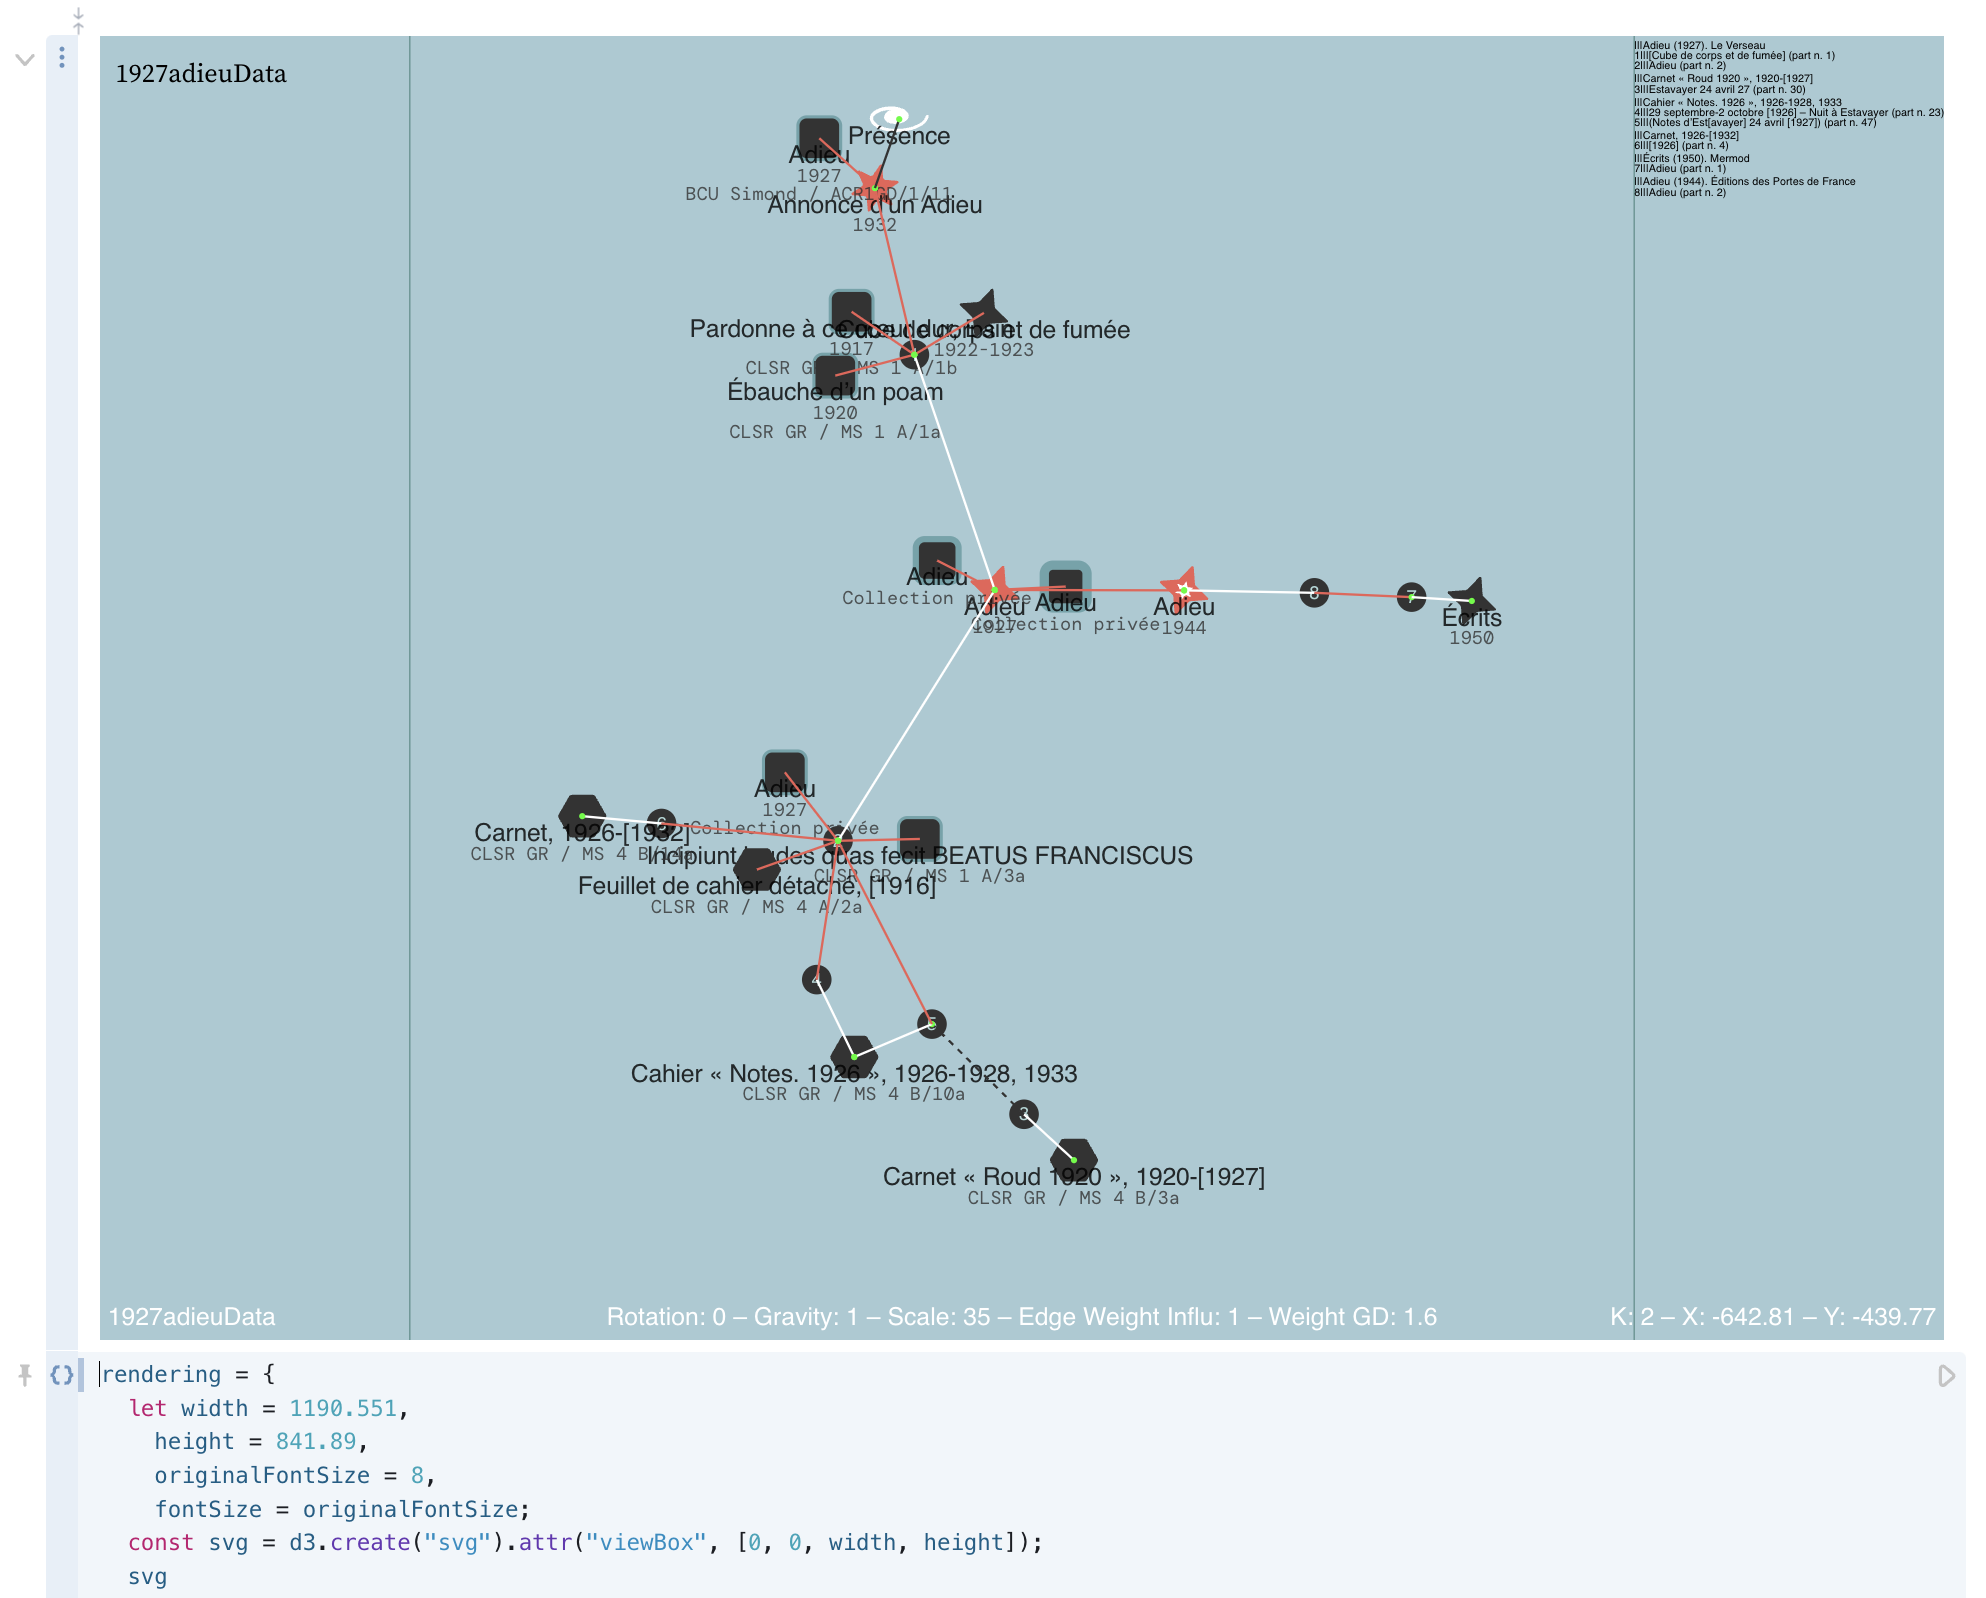
After that we created a notebook on ObservableHQ to produce semifinished SVG, that we then polished in Adobe Illusrtator, adding the embellishment and tidying up graphical elements. Having a “computational friend” was really helpful: many mistakes in the data (manually collected) emerged during the making of the artworks, as well as a few further occasions for improvements. Starting the graphical refining from a semifinished was key to success, because it allowed to spare time and energies.
Here are some of the final results.