In the information overload age, the user needs to find specific information without reading a huge collection of documents.
Topic modeling is a statistical model based on supervised and unsupervised algorithms that starting from an extended group of documents (corpus), allows detecting the treated shared topics starting from the identification of the keywords.
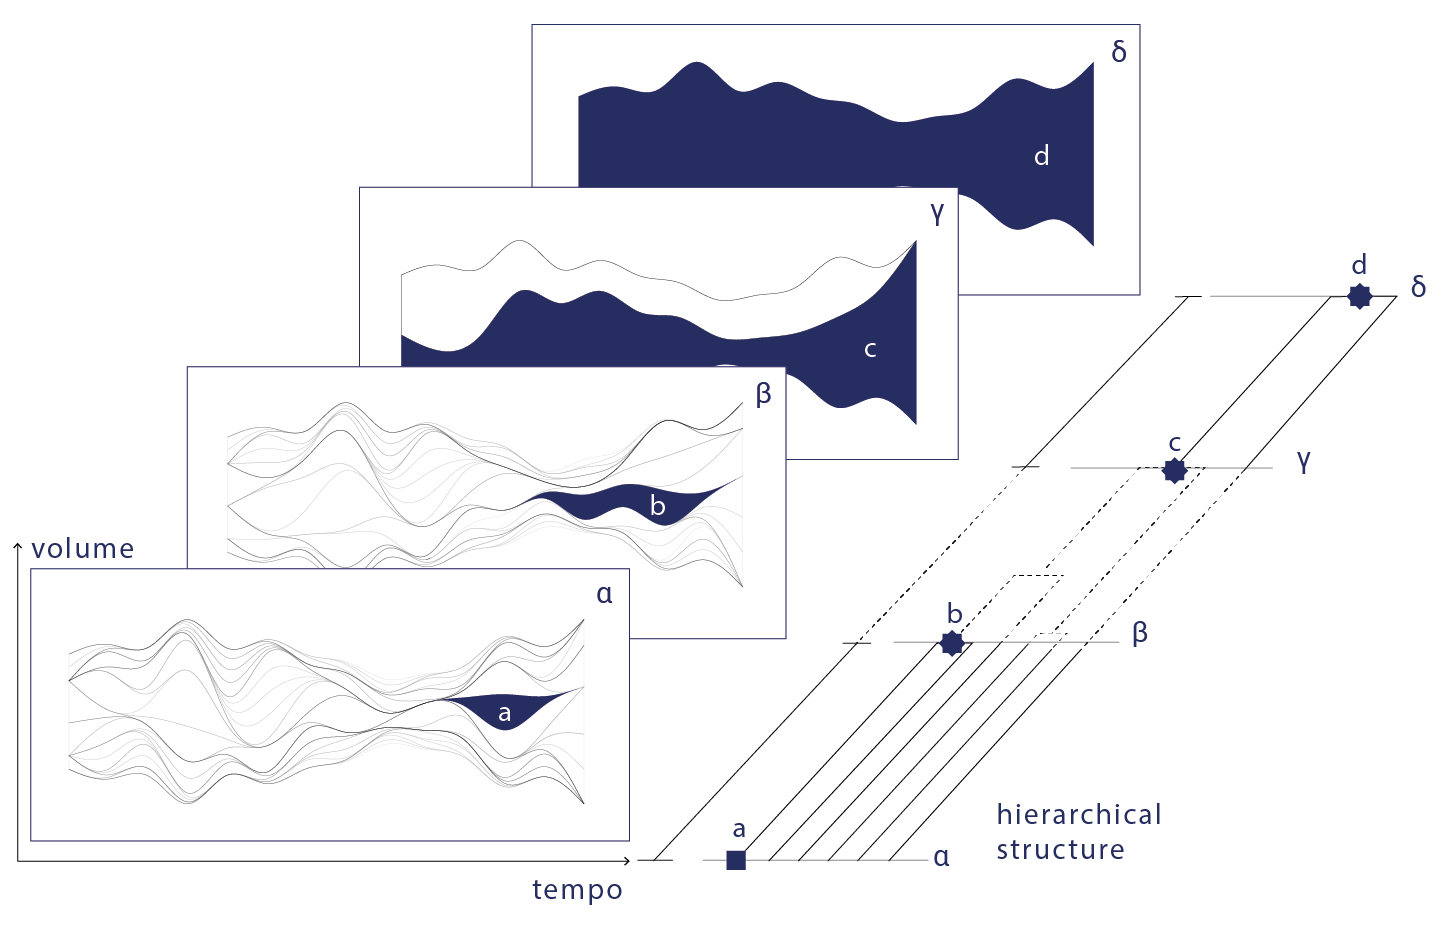
In the last decade, the contribution of data visualization has become fundamental to improve the analysis and use of data. Always addressing an expert and niche audience the visualization of the results of topic modeling has always been linked to visual models sedimented and known as the streamgraph, the word clouds and the force directed graph. During the initial research phase of this thesis, it emerged that a metaphorical approach to data complexity can facilitate its representation and usability through a simple and intuitive interface.
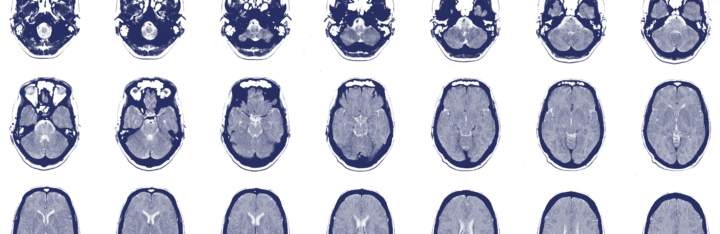
Initially, in Topic Tomographies (TopTom), a project in collaboration with ISI Foundation, the use of known visual models that evoke techniques of representation of the human body from the medical field has been experimented.
Finally, critical issues and limitations of the project allowed us to analyze thoroughly the characteristics of the data, turning on the interest for the definition and visualization of the topic itself, abstract entity and automatically generated by an algorithm.
Download the thesis here