Abstract
We are in a historical moment in which we entrust the last word to data. However, it is important to remember that data is a technical artifact created by man, an abstraction of reality. The implementation of an empathic component in data visualization can make us feel closer to the story that we are trying to tell, while still generating analytical knowledge.
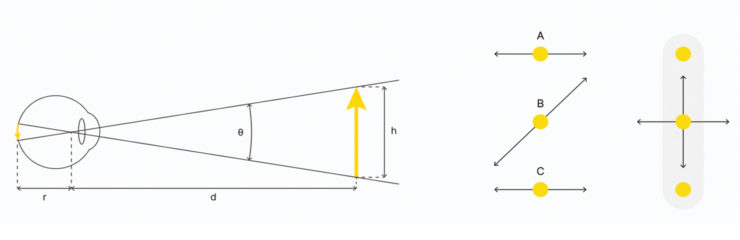
Historically, the literature on the subject has focused mainly on interaction and not on movement as a form of data-mapping. Bertin had already identified the movement as promising, although he claims to exclude it from his work due to a lack of scientific support for cognitive psychology. Today, we design for interactive interfaces and dynamic systems; these limitations are no longer present and offer exploration opportunities. What are the possibilities for data encoding on the visual channel dedicated to kineticism? How can these constitute the empathic component of data-representation?
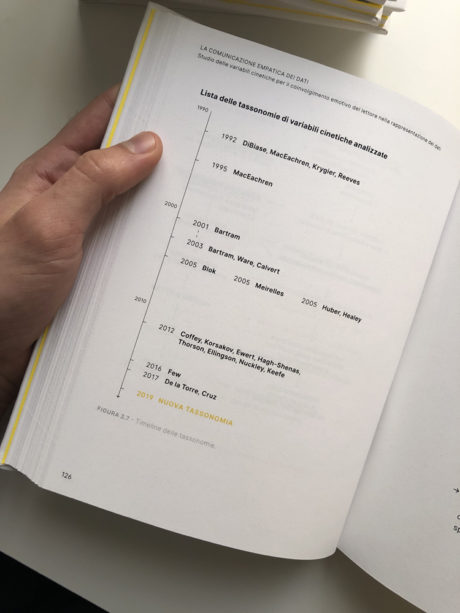
A bibliographic survey has revealed the interest of different authors in the topic but with very fragmentary and often disconnected studies. In this thesis I analyzed and reorganized the material in a taxonomy to understand how motion variables can be used in visualizing data to create empathy.
In parallel, I had the opportunity to test, refine and test this taxonomy with a real case study, Building Hopes, in which kineticism was used to visualize the data of Google searches, which I designed in the information design firm Accurat, in collaboration with Google News Initiative.
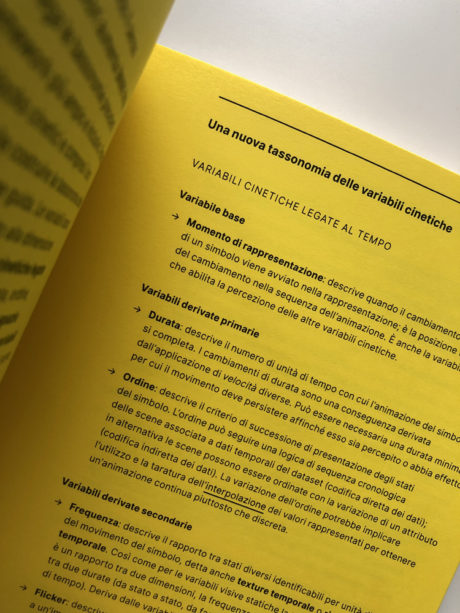
The thesis is a first step towards a tool for communication designers, supporting the design process through guidelines for the controlled implementation of kinetic variables. New audit are needed to better identify the limits of kineticism in data visualization and extend the research to other non-visual variables.

-
Index