
City Sensing
ICT Labs of the European Institute of Innovation and Technologies

The new Challenge for Urban Studies
There is an opportunity of describing the city which goes throughout the reading of the data the city itself is generating.
The aim of this project is to visualise the stream of information coming from the urban areas during big event days, in order to read and understand the behaviour of city itself through the data it is generating. Thanks to the proliferation of digital technologies, people are everyday leaving digital footprints by posting on social networks, hiring a bike or making a phone call, and this data might be collected and shaped in real time to offer new tools and insights which can help decision making process and achieve new findings.
This concept of Big Data has been merged with the concept of “City Pixel”, where the geographical unit of the urban space is a 250×250 meters, in which we aggregate our shaped data, and the basic timespan unit is 15 minutes.
City Sensing has been realised in two different versions: a web based explorative dashboard and a the dynamic narrative visualisation.
The Analytic Dashboard

The first step of the project was to build a tool capable to display the activity for every City Pixel and explore the information about mobile and social activity. The colours and the sizes of the cells might be relative to social sentiment, social activity, mobile activity and mobile anomaly, depending on what the user chooses.
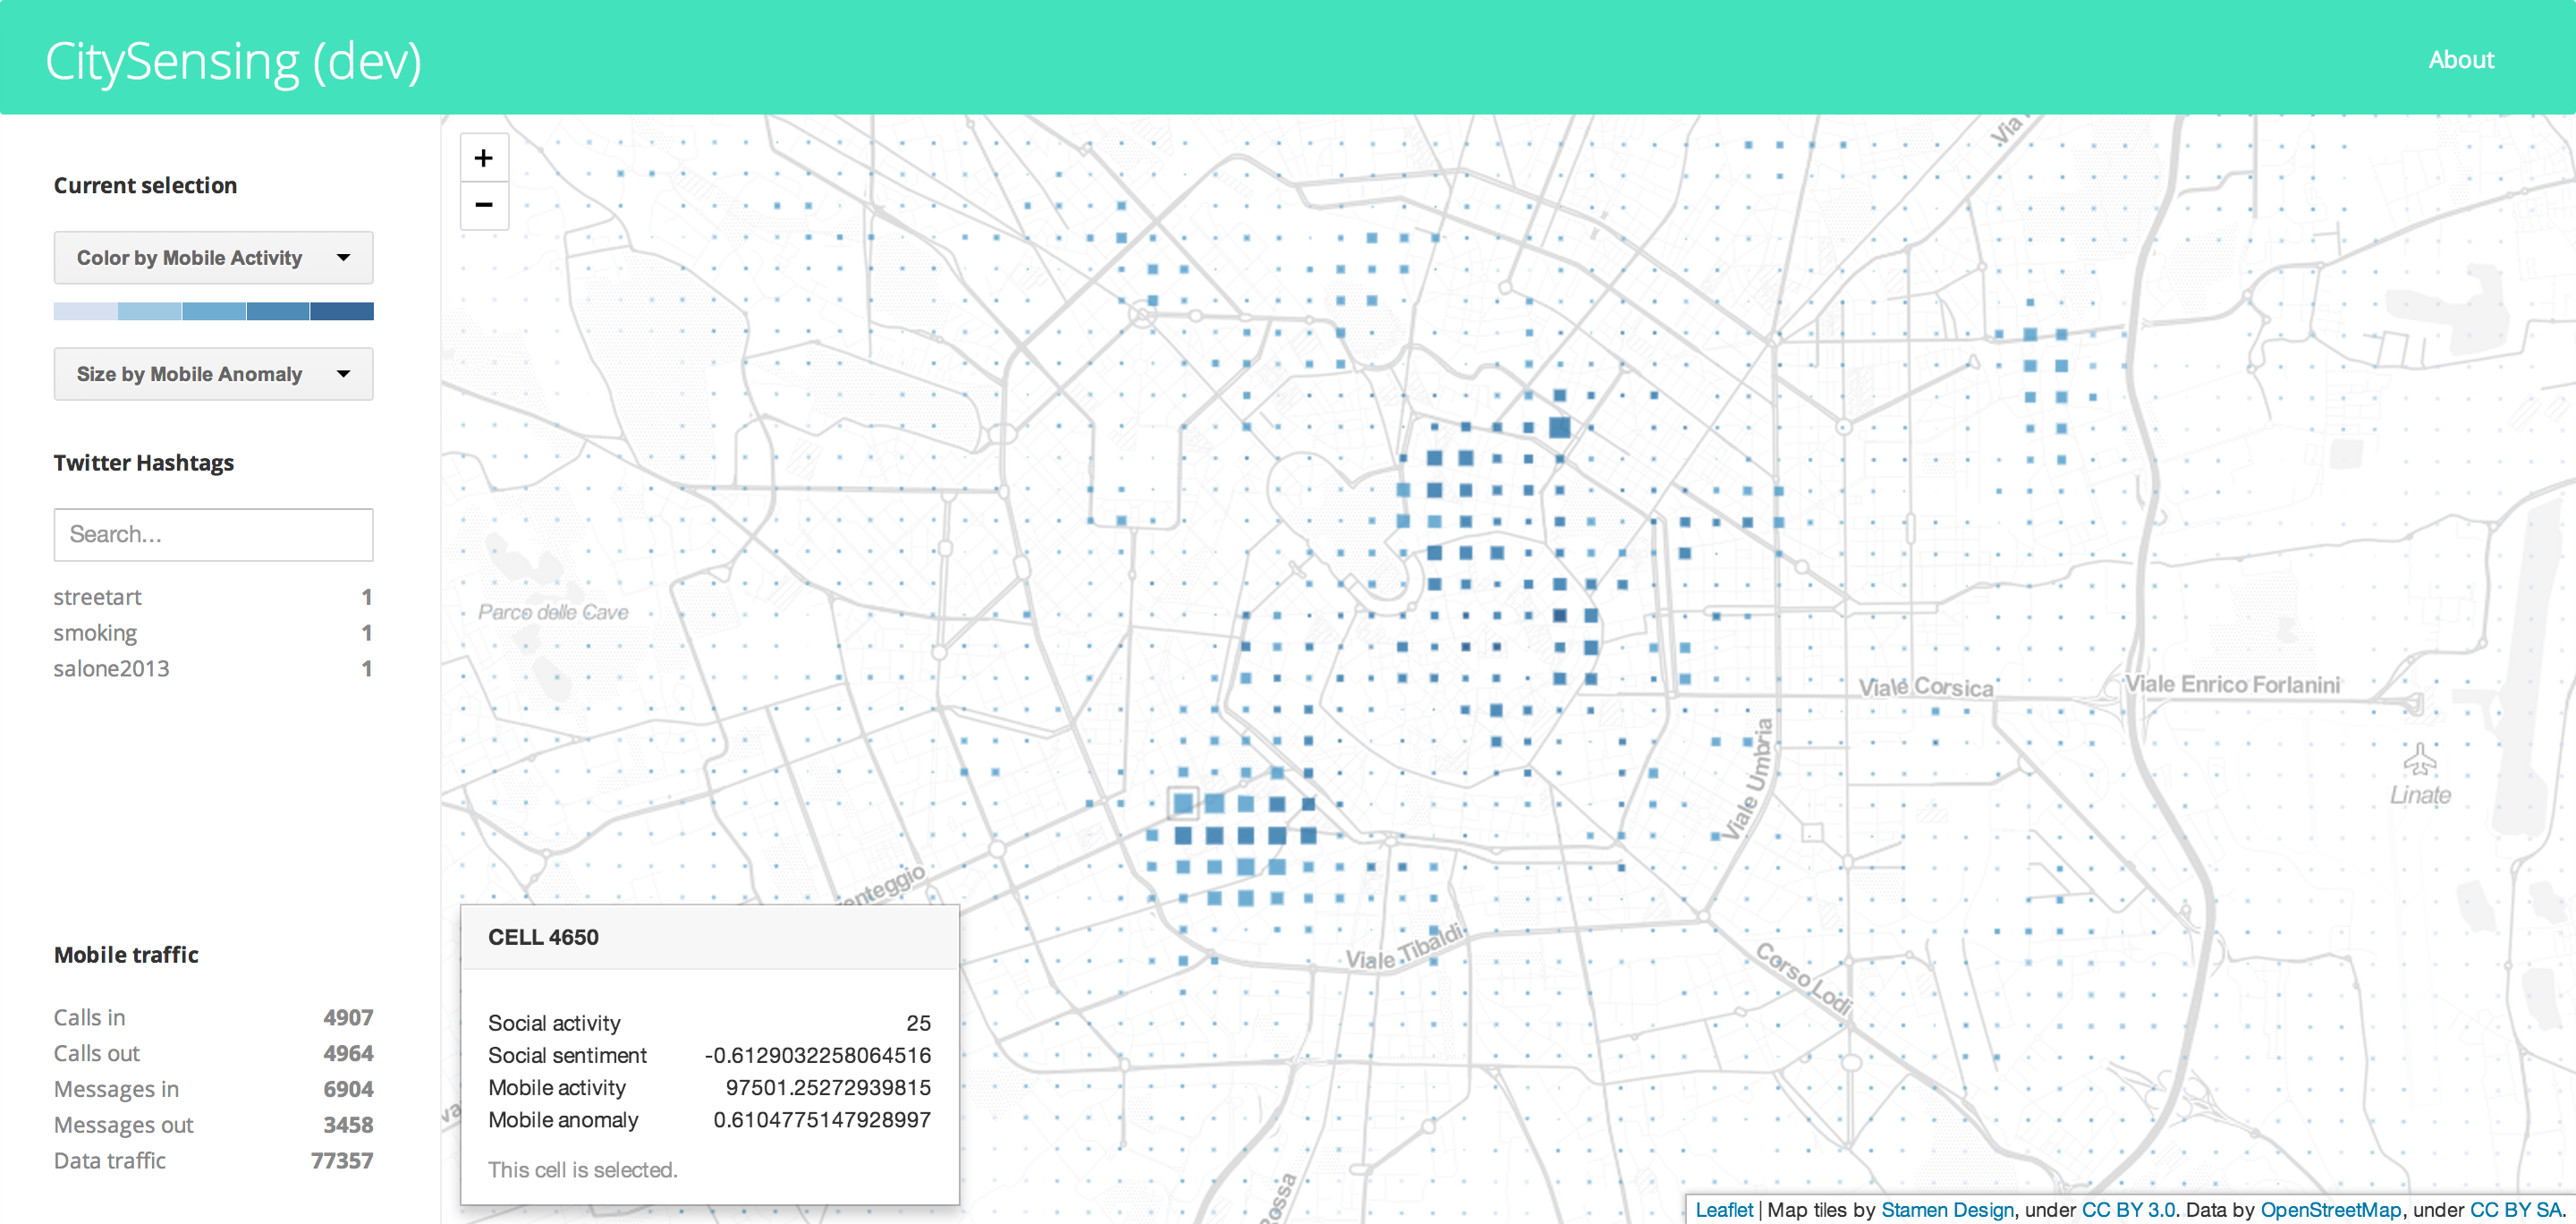
In particular the mobile anomaly is a useful parameter to display variations in the behaviour of the people which are not strong enough to be seen globally, but still they’re present and they suggest that something different is taking place in the city.
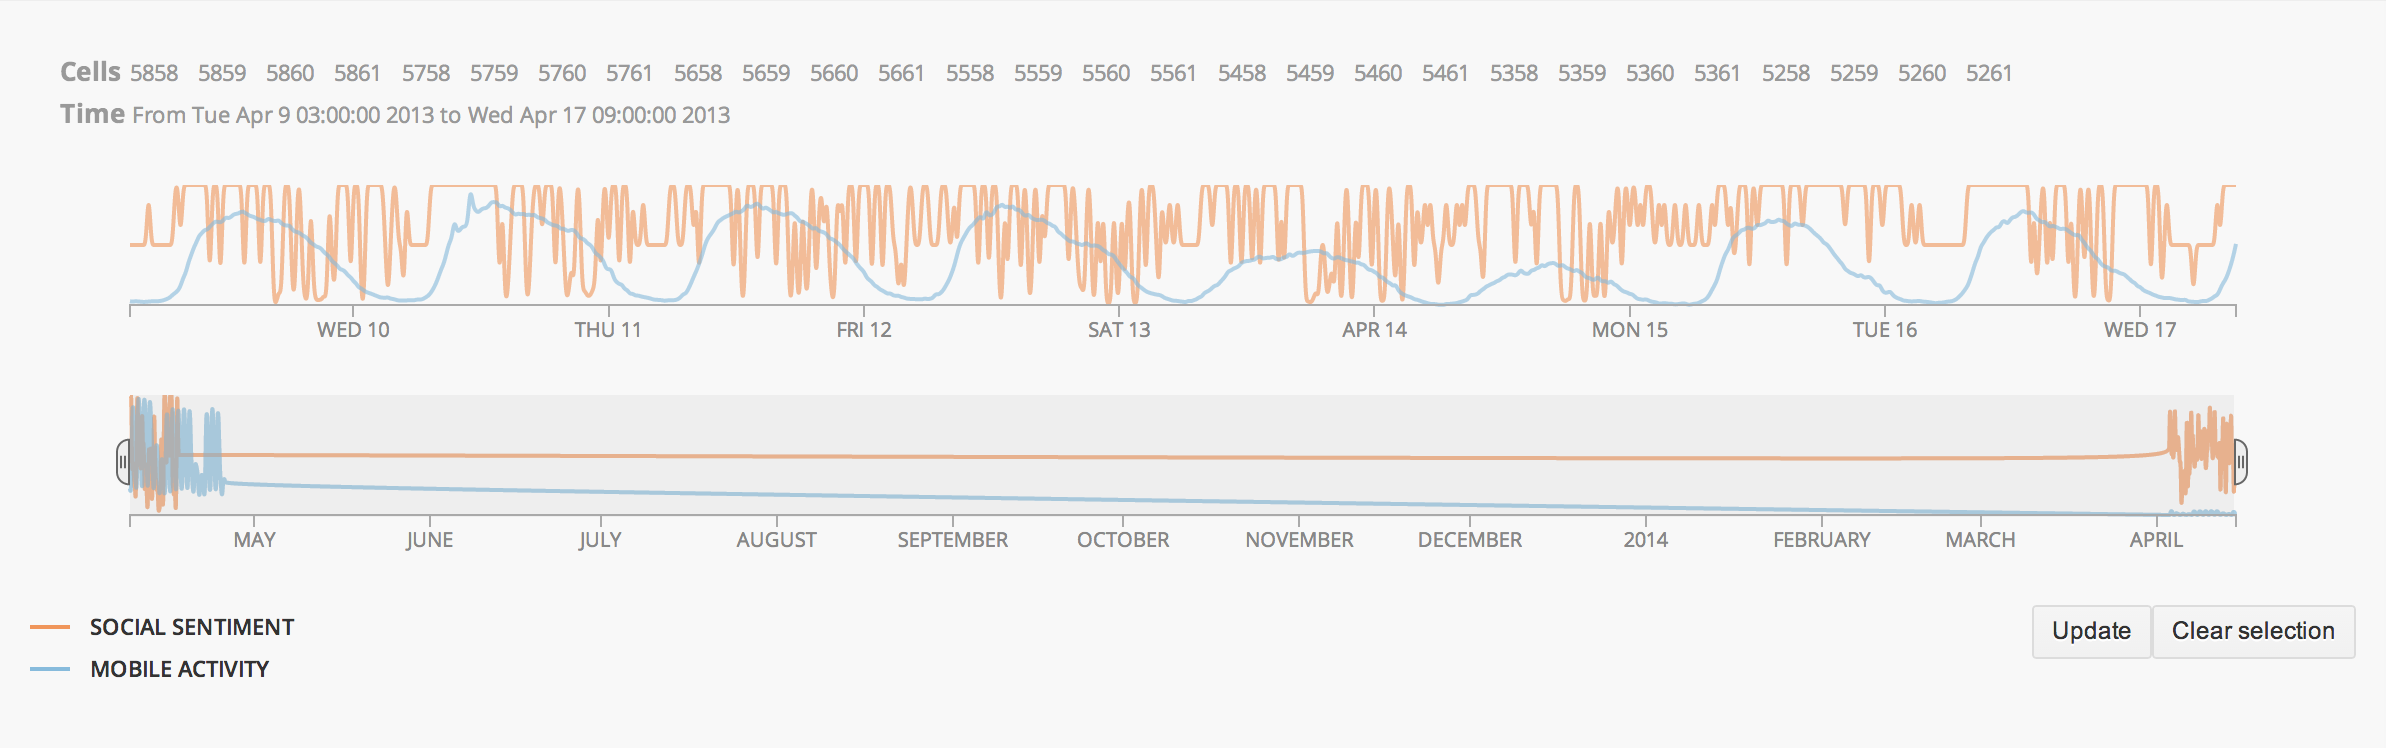
In more analytic moments, the user is even able to select a precise timespan on the line chart below the map and choose between different district as well.
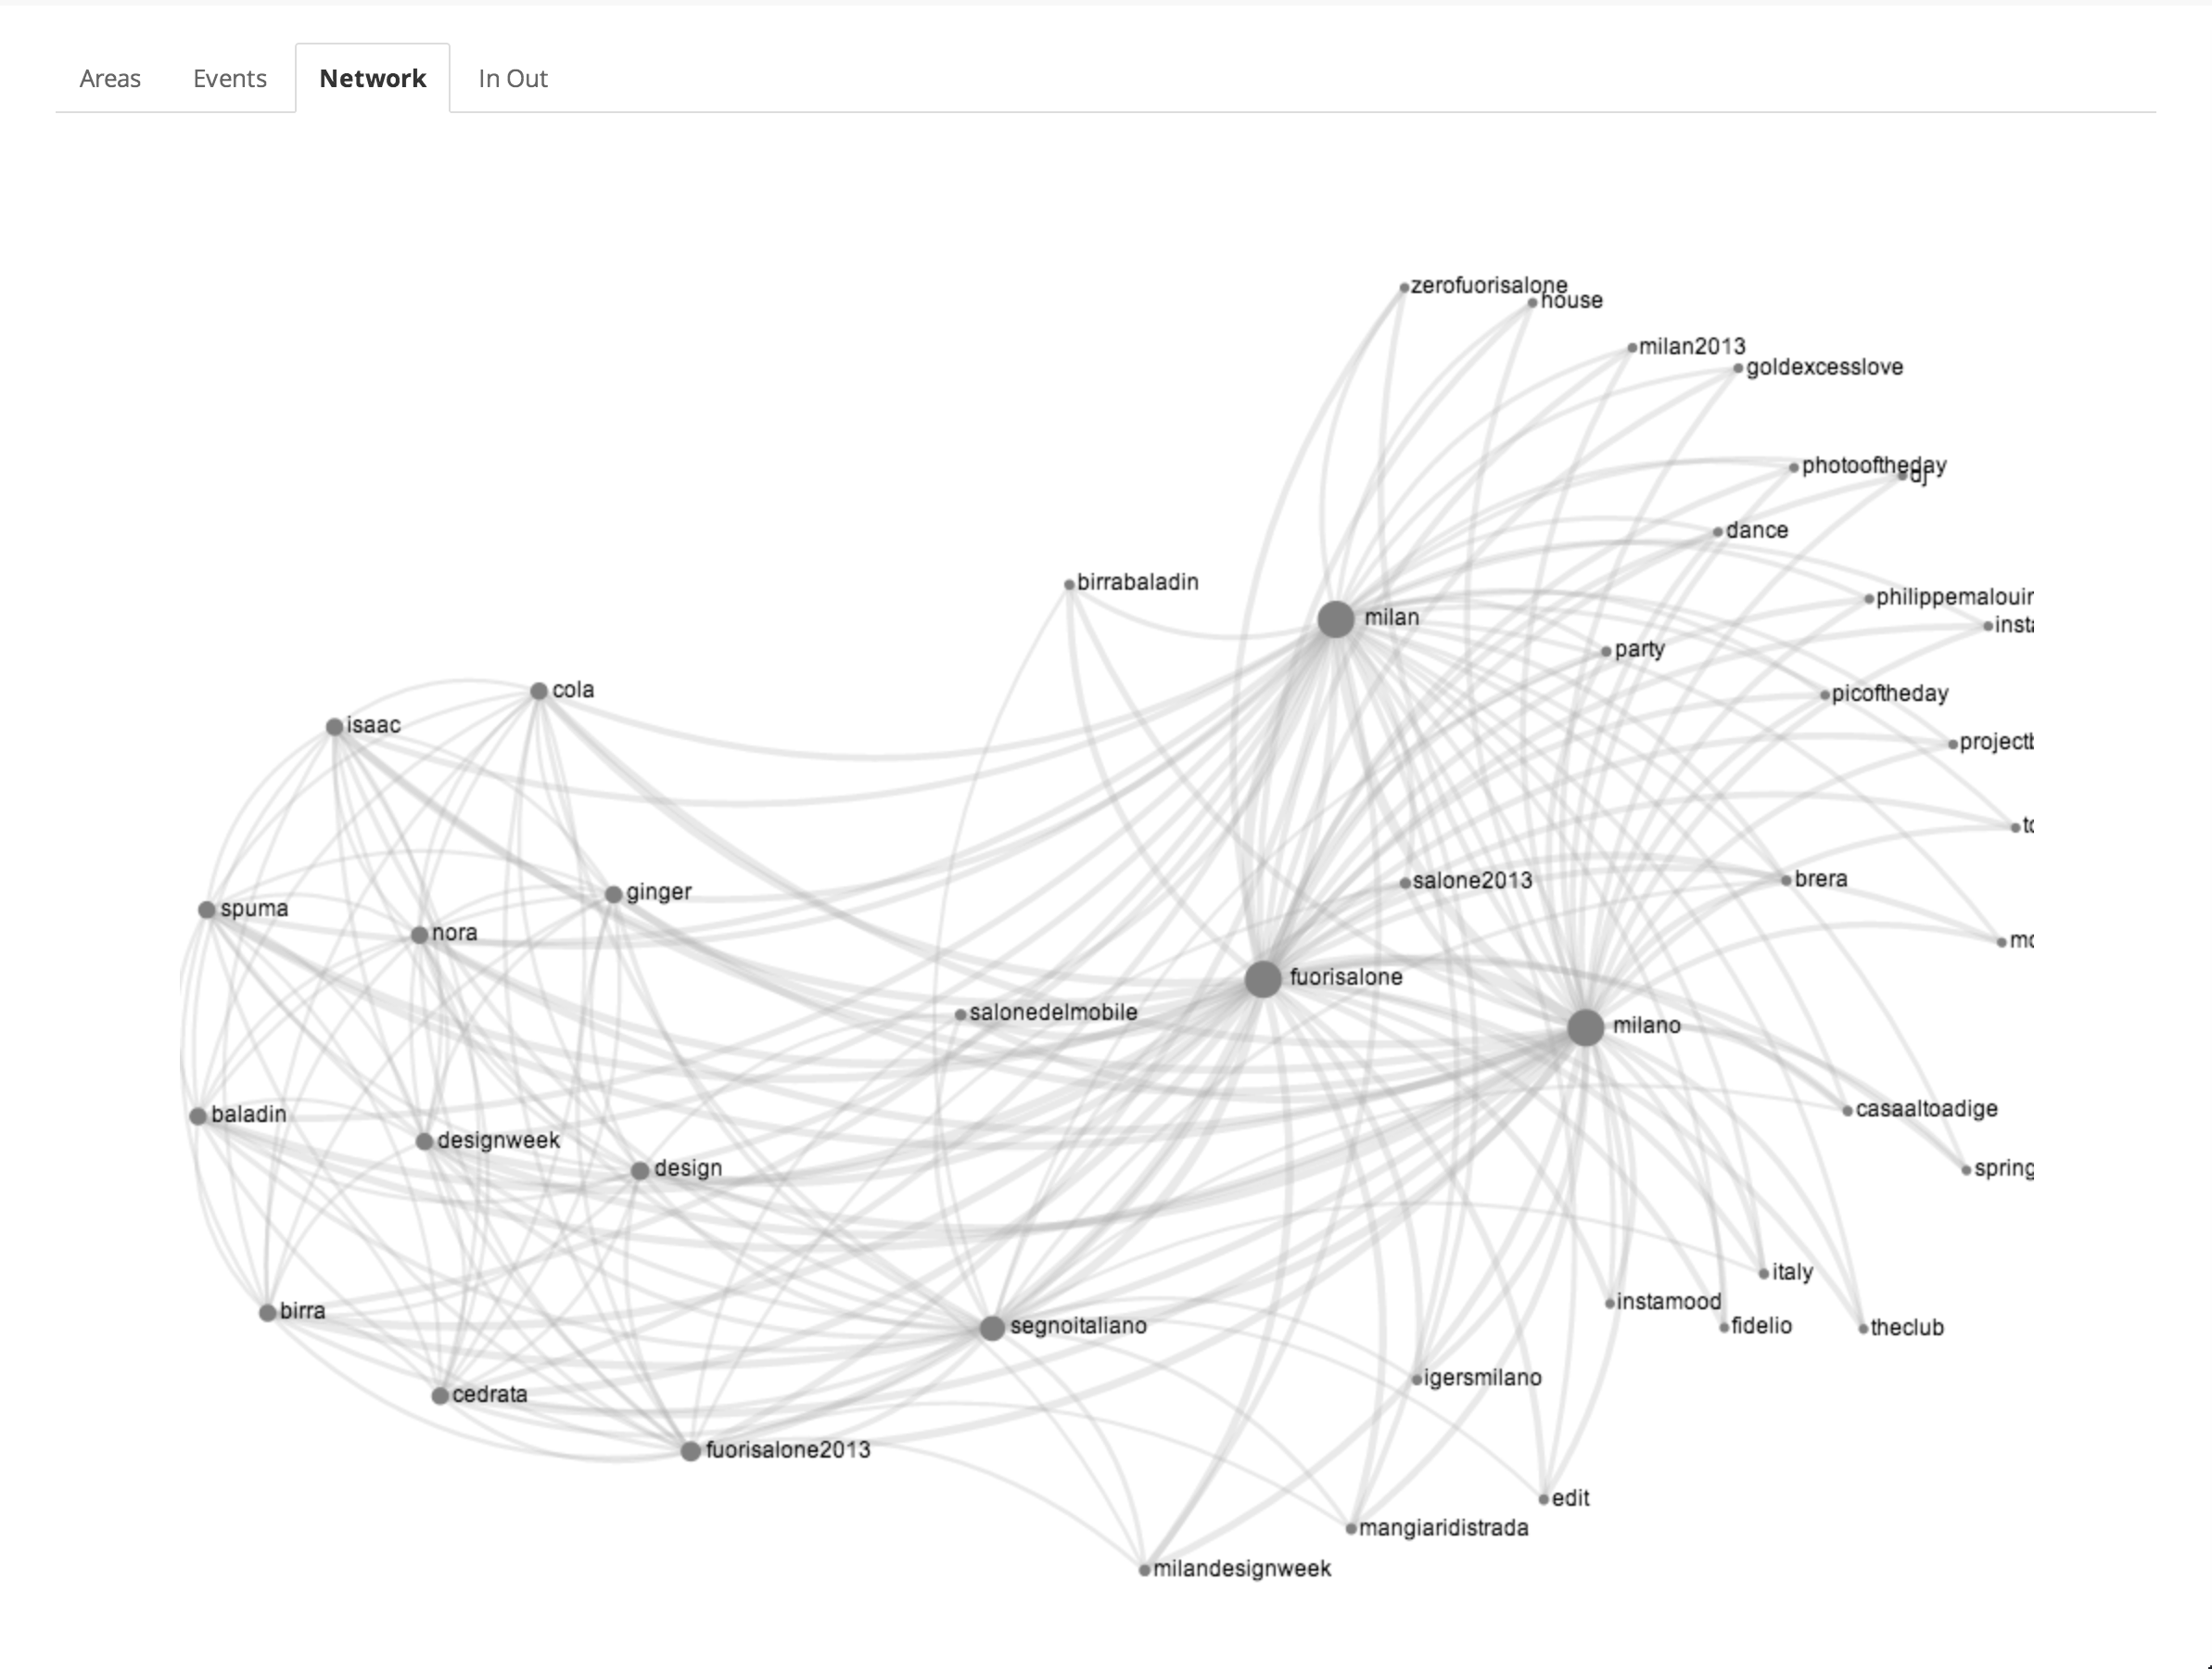
Last, but not less important, the co-occurrence network of hashtag and the list of in/out calls are available for further exploration.
Narrative Visualization
On the occasion of the Milano Design Week in 2014, DensityDesign Research Lab was asked to revise the City Sensing Dashboard platform and to produce an installation within the Mediateca of Santa Teresa spaces in the Brera District of Milan.
The dynamic visualisation was provided by two views, a geographical and a network one. The first is regarding the city itself with an highlight of some of the official district of Fuorisalone (Brera, Lambrate, Porta Romana and Tortona), in which we localise tweets, mobile calls and BikeMi stations. The latter is a users network graph in which the people are aggregated if they’re tweeting in the same area or about the same topics.
Geographical View
Network View
Video gallery: link.
Partners of the project
The project has been developed in collaboration with:
Semantics and Knowledge Innovation Laboratory (SKIL) of Telecom Italia;
DEIB: Dipartimento di elettronica, informazione e biotecnologie del Politecnico di Milano.