Visualizing Climate Change and Conflict » Quantities of images for the most climate vulnerable countries

Figure Seven: Quantities of images for the most climate vulnerable countries
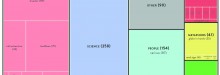
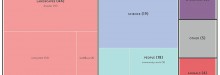
Figure Seven: Quantities of images for the most climate vulnerable countries