We have receive the visit from a friend that is now working at SENSEable City Lab at MIT, we shared opinions and project on information visualization; inspired by his stopover, we discuss the needs of being able to tell stories about what our visualizations. Paolo stated our reflections in a very effective way, saying we need to prove three abilities:
– Collecting consistent data
– Designing meaningful visualizations
– Telling amazing stories
About the third point I read a very interesting post by Shawn Callahan in Anecdote that can help us in improving storytelling talent:
there are three story plots we humans dearly love:
– the creativity plot where the protagonist solves one or more puzzles through shear ingenuity, persistence and always with a dash of dumb luck. The DaVinci Code is an example.
– the connection plot where people come together from different walks of life: different race, class, affluence, nationality, power. This week Sheen and I re-watched the movie Notting Hill which is definitely an example of a connection plot: famous celebrity connects with impoverished book store owner.
– the challenge plot where the protagonist faces a daunting challenge, everyone is sceptical whether is can be done, and especially by our hero, but in the end she triumphs. You might not have heard of Susan Boyle but this video is a classic example of a challenge plot told in 7 minutes.
Susan Boyle made me loving the challenge plot!
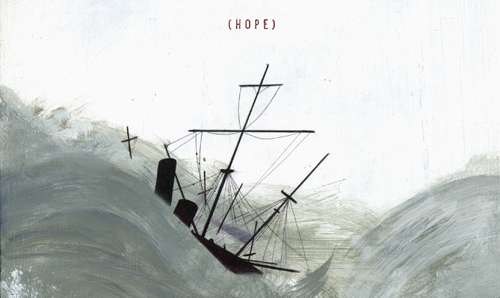
image via politewinter.com


[…] Telling amazing stories Simple points to consider, hard to execute when all three measurements of 1. Collecting consistent data, 2. Designing meaningful visualizations and 3.Telling amazing stories are actually more subjective than you think. […]
May 1st, 2009 at 8:48 amWell, it’s exactly where we are working on! I will say that the measurements are progressively more subjective going from point 1 to 3. Thank you for your suggestion.
May 4th, 2009 at 7:11 am