In 2015 Milan will host the Universal Exposition for the second time in its history. This happens more than one hundred years after its first time, in 1906. And while the 1906 Expo theme was transportation this time Milan will organize a universal exposition on the theme of Food with the title “Feeding the planet, energy for life”. But food is a very complex theme, being much more than mere feeding. In fact it has influenced history, environment, industrial economical and social development as much as tastes and art.
For this reason Expo 2015 S.p.A. asked DensityDesign to work on the Expo themes and generate a visualization able to communicate the complexity stemming from the relationship between food production and consumption; social and environmental concerns; technological and sustainability issues. The visualization should be also aimed at generating interest, while helping to explain the context and impact of the themes, rather than a pure analytical visual tool.
This time DensityDesign, much more than in other projects, was involved in the content organization process too: Expo strongly needed a deep reorganization of the themes to be able to make sense of their complexity.
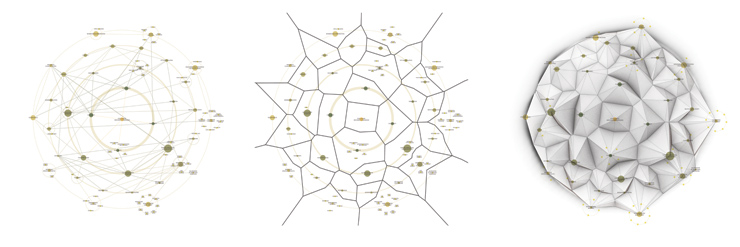
In the following paragraphs we will explain the structure and the process involved in the development of this project: we will focus on the cascade of network visualization needed to fully understand and make the network of ideas and concepts visible within the themes of the Expo. The concept of cascading is also described in some works of Bruno Latour and the process described by Moritz Stefaner in his discussion of bootstrapping visualizations, the execution of a series of actions that enables the execution of more complex actions.
Creating the network
DensityDesign collaboration with Expo served as a re-organization of the main theme and the identification of its sub-themes. First of all we needed to make a selection of the sub-themes, isolate them and trying to develop a network of relations among them.
Collaborating with Gloria Zavatta, the Expo 2015 person in charge for Theme Development, we started making our way in the complexity of the concept of food, outlining relations between different themes.
Starting from hand sketches on which we constantly worked in refining the connections among themes we then developed a final digital version of the network, on which we based the analysis of the themes interconnection.
Clustering
After generating the relational network the next step was to identify five main concept categories, by which the network’s nodes would be grouped.
- needs: what man needs to live, to meet his vital needs and his need to know;
- aims: the satisfaction of needs drives man to create products and to achieve goals;
- socio-economic system: is the productive, social, economic environment;
- phenomena: the main effects of human actions that all humanity faces today;
- measures: the most significant political, scientific, technological, managerial, cultural and educational activities that human beings can develop, with their capacity for innovation, to improve the planet for a sustainable future.
Each one of the categories relate with each other, creating different subnetworks, each one representing a different “story” connecting the various themes.
Once identified the clusters the network has been hierarchically organized by the identification of key themes, which are turned into hubs: pivotal nodes to which other satellite nodes are connected.
Even though the network was basically done what we needed was a graphical artefact than could work as a poster, something much more appealing and user-friendly than a “technical” network. For this reason we started working both on the layout reorganization and on the graphical representation of the themes.
The graphical layout
The network, although great to show connection between themes, was lacking a strong characterization and hierarchisation of the theme categories. What we needed was distributing the nodes in concentric circles, so that the “needs” category would be the centre of the network followed by aims, socio-economic system, phenomena and measures.
This reorganization of the network favors the clear division between clusters rather than highlighting connections between themes.
To introduce the landscape metaphor we created areas based on the position of the network nodes through the use of a Voronoi diagram and subsequently of its dual graph, the Delaunay triangulation. This way nodes would not sit amidst the area but are transformed in mountain peaks. The height of the peak is influenced by the degree (number of connections) of the correspondent node.
Pictograms and codes
Every hub theme is represented through the use of a pictogram able to easily convey the meaning of each theme. Each pictogram has been validated by the Expo experts after passing different review cycles.
The five rings of the visualization are isolated through the use of colors and lines. Moreover every theme category is represented by a specific colour, which is reflected both in the hub nodes and in the satellite ones. Hubs and satellites, as can be seen in the image below, are represented using different shapes to help the reader finding them in the alphabetically ordered glossary (positioned under the visualization, see flickr full image).
Target centered visualizations
As we have seen the Expo visualization was designed with different levels of refinement. While the last version is designed as a poster, a great share of work has been spent on designing the themes relational network. This means that this project generated two different outputs with two very different targets: a technical network for Expo’s internal use and a communicative visualization for the general public.
Starting from a working visualization we were able to design a very different one, with other aims and languages.
The visualization has been part of the Expo 2015 exhibition titled “1906-2015: verso l’Expo di Milano” at Triennale Milano museum. The exhibition is set to travel throughout Italy to introduce the Expo themes to the Italian population.
-
Extras


