
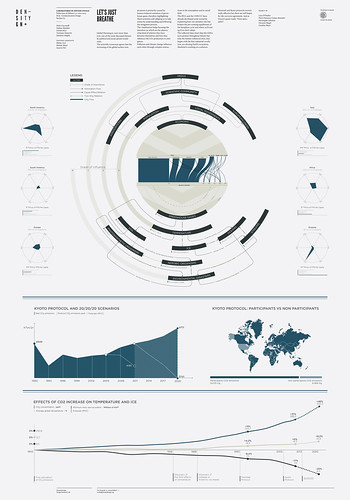
Poster: Let’s Just Breathe
Global Warming is, now more than ever, one of the most discussed themes by political and social parties worldwide. The scientific consensus agrees that the increasing of the global surface tem-peratures is primarily caused by human-induced emissions of greenhouse gases, therefore highlighting Man’s activities and obliging us to take action by understanding and following the mitigation process. The visualization helps focusing the attention on which are the players, what kind of relation they have between themselves and how they influence the CO production or mitigation. Pollution and climate change influence each other through complex interactions in the atmosphere and in social field. The IPCC and the UNFCCC have already developed some scenarios explaining how our emission rate has broken the pre-existing equilibrium of the biosphere cycle and where we’ll end up if we don’t adapt. The collected data clears that the GHGs wer present throughout history but only the human enhanced ones, that began with the first industrial revolution, are altering Earth’s ecosystem. Mankind is working on a solution: Montreal and Kyoto protocols weren’t really effective but there are still hopes for the 20/20/20 agreement. And as Cicero’s quote reads: “Dum spiro, spero”.
Report: Workin Class Hero
Climate Change is, now more than ever, one of the most discussed themes by political and social parties worldwide. In fact the pollution problem, and its search for solutions, always sparks a controversy that has an important weight in society. In a moment like this, where globally the western societies are living an economic downturn, a question that many heads of state are facing is: are we able to sustain an investment in clean energy? And do the governments even care about the pollution made by the forced production of our economy? Should we worry about our health more than our jobs or economy?
This significant macro-topic led us to question and analyze one of the biggest Italian piece of news of this year: the Ilva crisis. To understand some of this choice, as well as the actors and events analyzed during the execution of this protocol, we might have to report the crucial events of Ilva’s story.
In December 2008 the Regione Puglia approved a regional law against dioxin pollution putting a limit to infectious production. After some months the same political party decided to tweak this regulation giving more time to the factories to adapt. Meanwhile Nicola Riva became president of the Ilva. On July 26th 2012 a court order was called for the partial shutdown and seize of the Taranto’s steel plant by the Gip Patrizia Todisco; ten days later this order was performed and members of Riva Group board were arrested. The closing of the factory caused a medial and political fight. Strikes started and on the 27th of September a 48 hours strike took place defending the right to work. In November the workers occupied the management but the following day a tornado hit Taranto destroying the plant and silencing this controversy. Since the early stages the public and political opinion split into different sides; everyone was pulling its own arguments to conclude what was the nature of the problem: was it a health problem? An environmental one? An economic dispute? Maybe a work related issue?
Video: My Iron Lung
My Iron Lung, the summary video of our analysis starts from the beginning with the aim of explaining the whole process we did during the semester. We wanted to emphasize the real damage caused by the air pollution, specifically from the industrial production, to relate the theme to our single case, the italian Ilva Crisis. We used the metaphor of the gears and conveyor belt to simulate the productive process of a steel plant but also the print process of newspapers (as you can see in the report Working Class Hero, most of the web analysis is based on them). This video is basically a resume of the data and results we reach during the previous step of the project and is made with the intention of making them easily understandable helping us with a big part of storytelling.
References
http://corrieredelmezzogiorno.corriere.it/
http://bari.repubblica.it/
http://www.ilvataranto.com/
http://www.ncdc.noaa.gov/paleo/recons.html
Data:
– CF4 emissions by country (World, 2008, IPCC)
– CH4 emissions by country (World, 2008, IPCC)
– C02 emissions by country (World, 2008, IPCC)
– HFC emissions by country (World, 2008, IPCC)
– N20 emissions by country (World, 2008, IPCC)
– SF6 emissions by country (World,2008, IPCC)
– Energy world expenditure by country from 1980 to 2009
– Total aggregate anthropogenic emissions of greenhouse gases in 1990, 2000, 2005, 2008 and 2009
Authors
Luca D’Onofrio
Pietro Francesco Guinea Montalvo
Mariangela Labranca
Giovanni Magni
Carolina Lucia Mauri