Data and Information Visualization are both a communication tool and device to relate phenomen and explore them. A phenomenon, especially if complex, it may be faced through the development of visual forms, just as the night sky has been simplified thanks to the invention of constellations.
The observation of the insecurity phenomenon in one of its specific features, although developed as one single artefact, has been faced in two distinct phases:
In the first phase student groups were asked to gather statistical data from official sources (e.g. ISTAT, the Italian National Institute of Statistics) trying to visualize as precisely as possible the way the official sources communicate the phenomenon.
In the second phase groups focused on one feature of the phenomenon, highlighting one actor within the system, and reconstructing it through a actors-relations-flows that has been explained during the course.
The given themes were:
- Education
- Family and Society
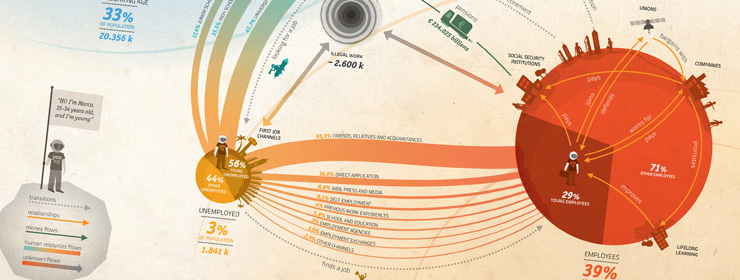
- Work
- Health
- Personal Security
- Environment
See all the projects on flickr!