Following the Food Atlas by Giulia De Amicis, we are glad to continue the series presenting the M.Sc Thesis Project of Valerio Pellegrini – Master in Communication Design at Politecnico di Milano.
Introduction
Minerva is a web tool for supporting philosophical historiography research, born from a multidisciplinary collaboration between the DensityDesign Research Lab and a team of philosophical historians from the University of Milan. Initially conceived for exploring Immanuel Kant’s corpus, Minerva allows researchers to work on large corpus of texts by bringing together data visualizations and text annotations. Focused on the evolution of one author’s lexicon, the tool provides two main views on the text. The first one is a visual representation of the whole evolution of the lexicon across the different works of the author, showing and comparing terms frequency. The second one is the ability to access and work on the text by searching and highlighting lemmas and creating annotations at different levels of scale, such as words, paragraphs, or chapters.
Beside simplifying and speeding up the research process in the context of philosophical historiography, Minerva aims also at providing new ways of looking at the texts and generating new possible paths of investigation. The possibility to observe the whole evolution of one or more author’s thoughts as well as the ability to easily move across his or their works fosters a new kind of dialog with the texts: the concept itself of reading takes the form of an interactive and dynamic process that moves between the direct and close access to the text and the distant view provided by the visualizations.
The case study: Kant
The tool stems from a collaboration between the DensityDesign Research Lab and a group of researchers from the University of Milan focused on Kantian Studies, based on the exploitation of data visualization as support for the analysis of the text. The usual research work is based on browsing thousands of pages, looking where and how lemmas appear, identifying structures and patterns of evolution and other elements useful to support the reconstruction and the interpretation of one author’s thought. The idea of combining data visualization with text annotation stems from the will of providing, in a single environment, both a synoptic vision of the whole corpus and the ability to collect together hundreds of notes and comments in their specific context.
Data extraction and organization
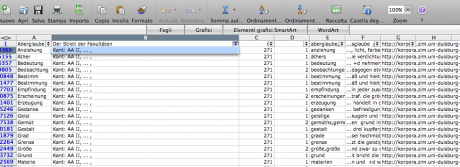
The research started with the selection of 1000 of the most relevant words in the Kantian corpus that have been searched across the whole Kantian work (58 works, 4500 pages) using the Korpora search engine developed at the Universität Duisburg-Essen. After numerous attempts, characterized by a progressive refinement of the search criteria, a list of all the word occurrences in the respective pages and works has been obtained. From this list a first words/works network has been developed.
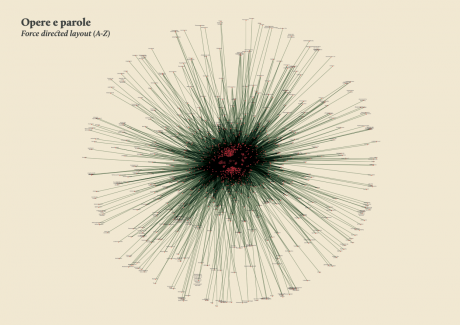
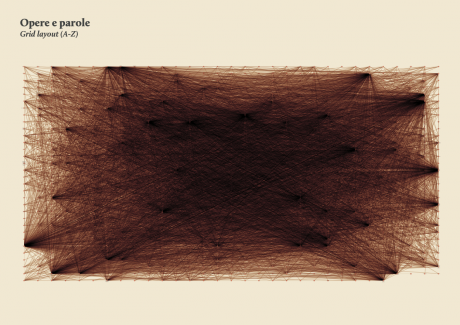
Words/works network
The network provided the researchers with a single view of the relationship between the words across the entire corpus, offering them a new perspective from which to look at the text. Despite an initial moment of skepticism by the researchers, mainly due to the high density of elements and relationships in the networks, issues of particular interest emerged. For instance, the Spring Embedded Layout, a type of circular diagram provided by Cytoscape (a network analysis tool), showed at first glance those words that appear only once in the Kantian corpus – called ‘unicum’ by researchers.
Since the purpose of the research was to visualize the evolution of the lexicon, making possible for philosophers to examine the data, validate assumptions and provide new insights for future research, it was therefore necessary to find a visual model capable to show the lemmas evolution at a glance.
The visual model
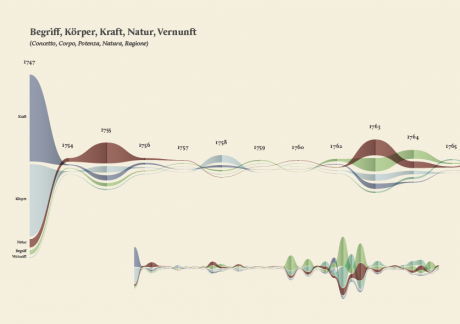
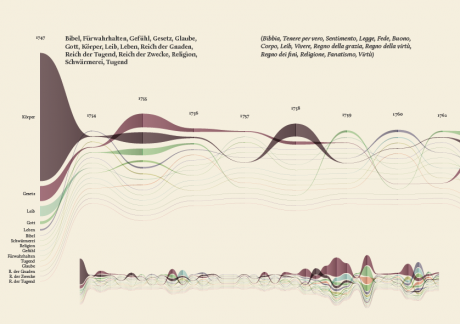
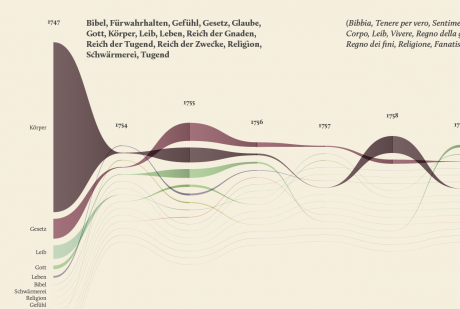
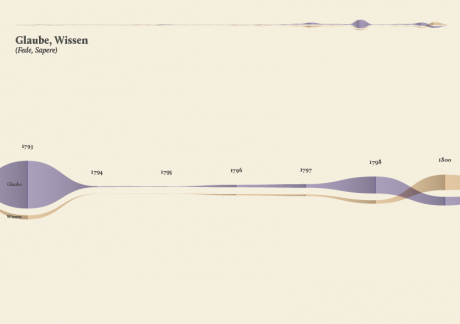
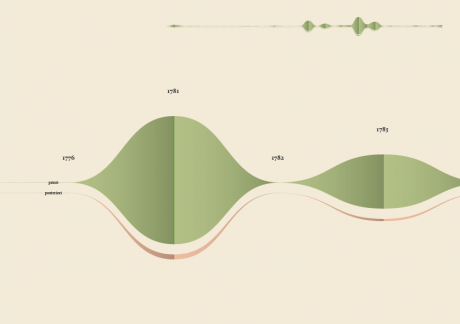
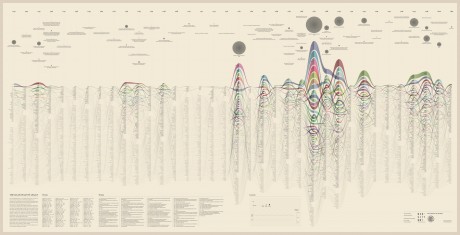
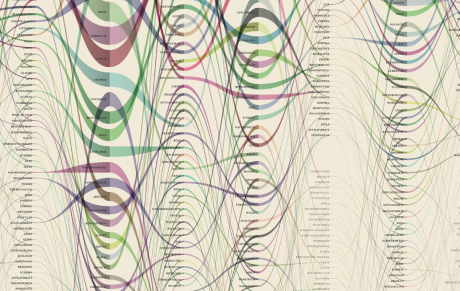
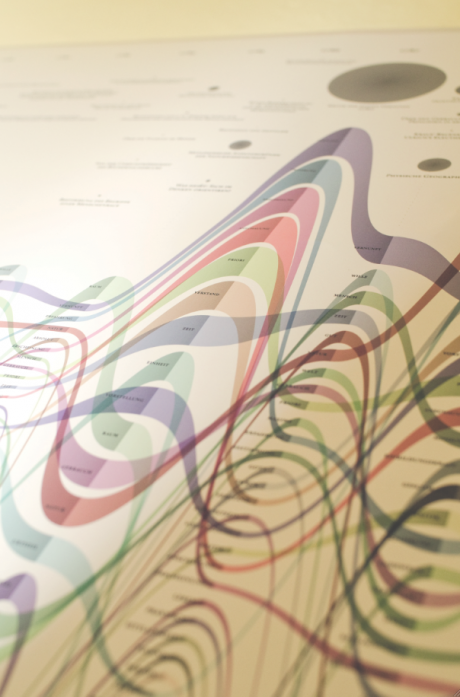
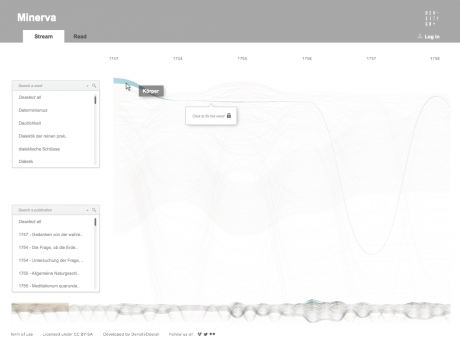
The streamgraph has been figured out as the most effective visual model, since its ability to show the evolution of lemmas (in quantitative terms) across the works (and the time) and, at the same time, to compare them work by work. A particular version of the streamgraph has been developed to separate the flows and to highlight words’ frequency. Once the data have been structured for this visual model some first drafts of the streamgraph have been realized using Scriptographer (an Adobe Illustrator plugin), aiming also at collecting some first feedbacks from the researchers, about the visual model and its readability. As a first result, the visualization has confirmed already known patterns (as the evolution of key terms in the Kantian corpus, such as ‘Ding an sich’ and ‘Noumenon’). But at the same time, the intricate architecture of Kantian vocabulary, immediately assumed a tangible shape.
The poster: The Atlas of Kant’s Legacy
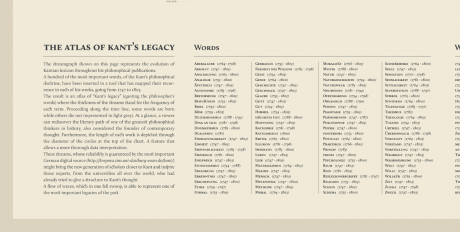
During the research process, an idea can actually takes shape while exploring texts, playing with it and jumping through pages and concepts. The work of researchers can stem from the evidence of an enigmatic pitch or a word in an unusual context. Starting from these considerations, we decided to provide the researchers with a view showing the relationships between the lemmas evolution at a glance, as a tool to freely explore the streams. A poster, sized 200×100 cm, has been printed to work as an historical atlas of the words, representing a privileged point of view to examine the top 100 most important words of Kant’s production. HQ version here.
Minerva
While the poster has been received positively by the researchers, it allows to examine the evolution of only 100 selected word and it does not provide a direct access to the text, which is essential for the kind of work carried out by the scholars. Thus, the next step has been the design of an interactive tool to browse and view all the terms and, at the same time, to directly consult the text. Starting from the positive results of the previous visualizations, and in particular the streamgraph view, we had the idea of combining in a single environment the exploration of the words stream, with the ability to work directly on the text. In this way it would be possible to search, trace and study the words in the context they have been used and to add comments and annotations to the text. From these considerations, Minerva has been conceived.
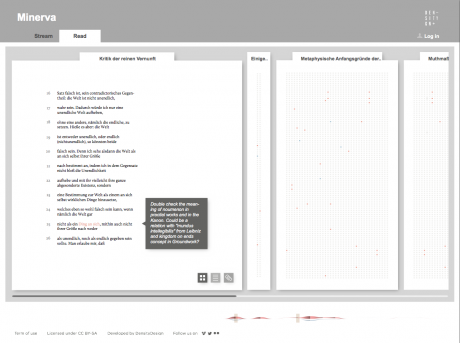
Minerva is a web tool that aims at integrating close and distant readings of a text using data visualizations and text annotations. A streamgraph allows to look at the evolution of an entire corpus’s lexicon, work by work, with the possibility of focusing on specific work or lemmas. An annotation system, instead, makes easy to approach the actual text in an incremental way and to add notes to any part of it.
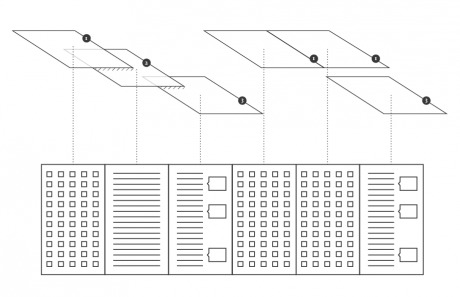
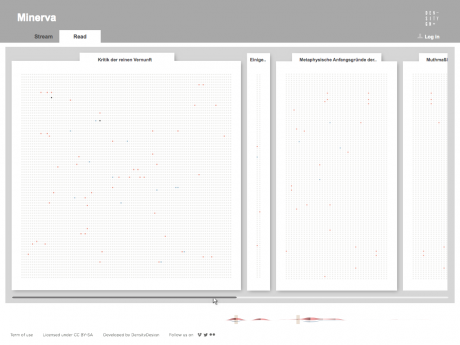
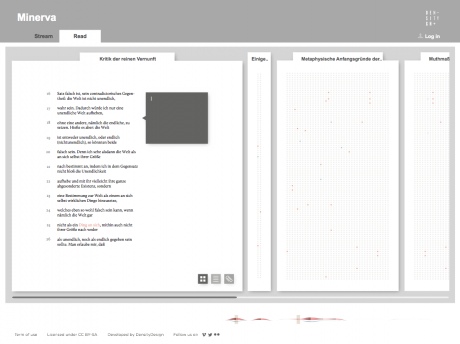
Selecting one or more streams of words, the researcher can observe in a second moment in which parts of the works they appear, progressively approaching the written text (each square corresponds to a verse). Selecting a square then he can enter the text and read the verse (this step allows to switch from the synoptic view of the presence of the words in the verses to the corresponding verse, fundamental aspect for the researcher). Once in the text, notes can be attached to the verses, which will enable the scholar to build its research process. A structure of this type allows to compare works between them through different reading levels.
Conclusions
Minerva has provided a very interesting opportunity to experiment with data visualization within a context, the philosophical historiography, where the use of visual languages is still poorly investigated. The design process has not been simply limited to the technical implementation of pre-established requirements but has moved across a continuous and dialectical collaboration between the parties involved, generating a fertile and agile research environment. The achievements reached so far by the two actors involved are a promising starting point for further investigations and a confirmation that communication design can play an important role within the development of new humanities research tools, based on digital and visual environments.
Currently, Minerva is still under development, but as soon as the tool will be completed, we plan to furtherly test it and improve it, taking advantage also to feedbacks coming from philosophical conferences and communities, at both national and international level. Moreover, we would like to better understand the contribution that Minerva can bring outside the specific context of Kant’s corpus and philosophical historiography, as a support for the analysis of texts by other authors and within other domains.
If you have any comment, suggestion or if you are interested in the development of Minerva, please contact Valerio Pellegrini (valerio.pellegrini.aog@gmail.com) or DensityDesign Lab (info@densitydesign.org).























[…] Minerva – Data visualization to support the interpretation of Kant’s work | Density Design […]
August 10th, 2013 at 1:45 pm[…] Minerva – Data visualization to support the interpretation of Kant’s work | Density Design […]
August 12th, 2013 at 7:38 am[…] The shortlist for the 2013 Information is Beautiful Awards has been released. In the Data Visualization category, I voted for “The Atlas of Kant’s Legacy” (below) by Valerio Pellegrini, a study of how Kant’s philosophical vocabulary changed over time. This is work that Valerio conducted for his M.Sc. thesis. […]
October 29th, 2013 at 1:02 pm[…] favorite data visualization: Kant – you can read more about it here. Besides this, I prefer bar or line chart over bling-bling maps or fancy […]
November 6th, 2013 at 9:36 pm[…] favorite data visualization: Kant – you can read more about it here. Besides this, I prefer bar or line chart over bling-bling maps or fancy […]
November 8th, 2013 at 3:26 pm[…] visualización favorita: ‘Kant’. Y en general, prefiero los gráficos de barras o líneas a las visualizaciones brillantes y […]
November 12th, 2013 at 8:12 pm[…] Philosophie in Form von sehr schönen Infographiken … Share this:TwitterFacebookGoogleLinkedInE-MailDruckenGefällt mir:Gefällt mir […]
April 14th, 2014 at 4:47 amHi, I want to know where I can buy the book.
October 24th, 2015 at 1:27 am@Paula Garrido the book is available only in digital format, you should contact the author (Valerio Pellegrini) to access it.
best
November 1st, 2015 at 10:48 amDD team